

What is MACD in Forex
The MACD (Moving Average Convergence/Divergence) was originally developed by Gerald Appel, a stock market technician, in the late 1970s (Appel, Gerald. The Moving Average Convergence-Divergence Method. Great Neck, NY: Signalert, 1979). MACD is the second most popular indicator used as a basis for technical analysis.
It is used to spot changes in the strength, direction, momentum, and duration of a trend in a stock’s price. There have been many other technical tools that have been developed since the MACD, but it has remained a favorite and useful tool by traders over the course of time.
Popularity is difficult to quantify, but according to a quick review into the free indicator/EA repository of desynced.net, MACD is the second most popular indicator used as a basis for EA construction:
| Popularity Rank | Indicator | EAs Based Upon | Indicators Based Upon |
|---|---|---|---|
| 1 | Moving Average | 886 | 2353 |
| 2 | MACD Histogram | 273 | 255 |
| 3 | RSI | 257 | 547 |
| 4 | Stochastics | 196 | 331 |
| 5 | CCI | 138 | 333 |
| 6 | Parabolic | 129 | 140 |
| 7 | Bollinger Bands | 67 | 146 |
| 8 | Larry Williams Percent Range | 62 | 183 |
| 9 | Movement Directional Index | 59 | 240 |
| 10 | Momentum Indicator | 45 | 68 |
The MACD is yet another attempt to solve the lagging problem of the moving average crossover. As has been noted with the simple moving average, and longer lengths, by the time you get a signal or crossover, the move may be almost over. To make them more sensitive to the current market, traders have developed exponential moving averages (EMA), which gives more weight to current prices. The MACD also uses the EMA in its calculations, as it compares the difference between a fast period EMA and a slower period EMA, with the standard periods being 12 and 26.
The MACD consists of three components:
- MACD line – the difference between the 12 and 26 period exponential moving average (EMA). Subtract the longer EMA (26) from the shorter EMA (12)
- Signal line – the 9 day EMA of the MACD line
- Block histogram – the difference between the MACD and the signal line
MACD line: The MACD line is the 12-Period EMA minus the 26-period EMA. If the MACD line is positive and rising, the rate of change between the 12 day and the 26 day is increasing. This is a positive momentum and indicates a bullish period. If the MACD line is negative and falling, the short-term indicator is falling faster than the long-term and shows the market is going down.
Signal line: After the MACD line is determined, a 9-period EMA of the MACD line inserted as the trigger and it is called the MACD signal line. When the MACD line goes above the MACD signal line, this is a bullish signal. A move below the MACD signal line is a sell signal.
Example: USDCHF daily chart.
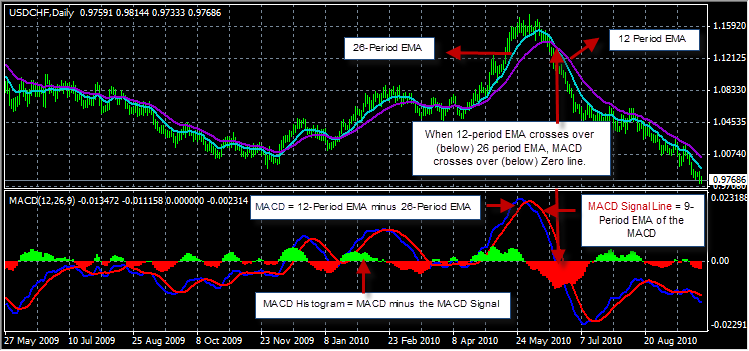
As you can see, when the 12-Period EMA crossed below the 26-Period EMA, the MACD crossed below the Zero Line. This could have been a nice entry for a long run downwards. A better entry can be found just prior, when the MACD (blue line) crossed below the MACD Signal Line (red line). The histogram illustrates this crossover by indicating a red histogram forming underneath the Zero line.
The MACD presents traders with three strategies:
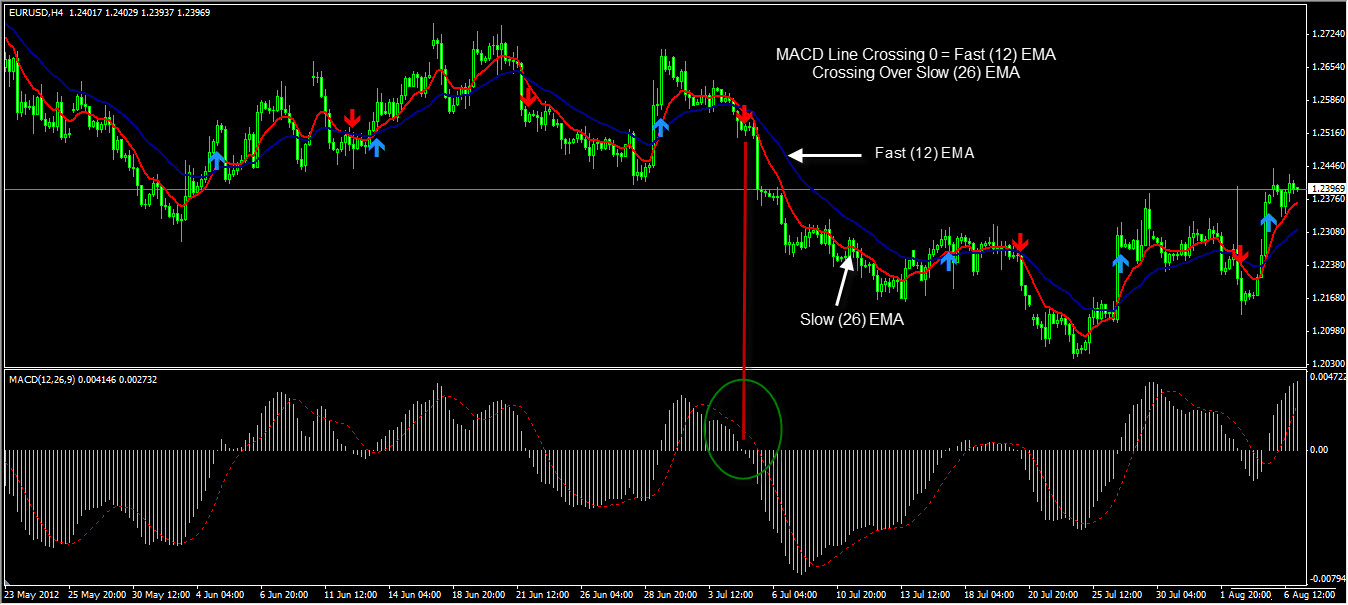
Strategy #1: Crossing the 0 line
A move by the MACD line above the 0 line is a buy signal, while below is a sell signal. This is the same as the 12-period EMA crossing over the 26 period EMA.
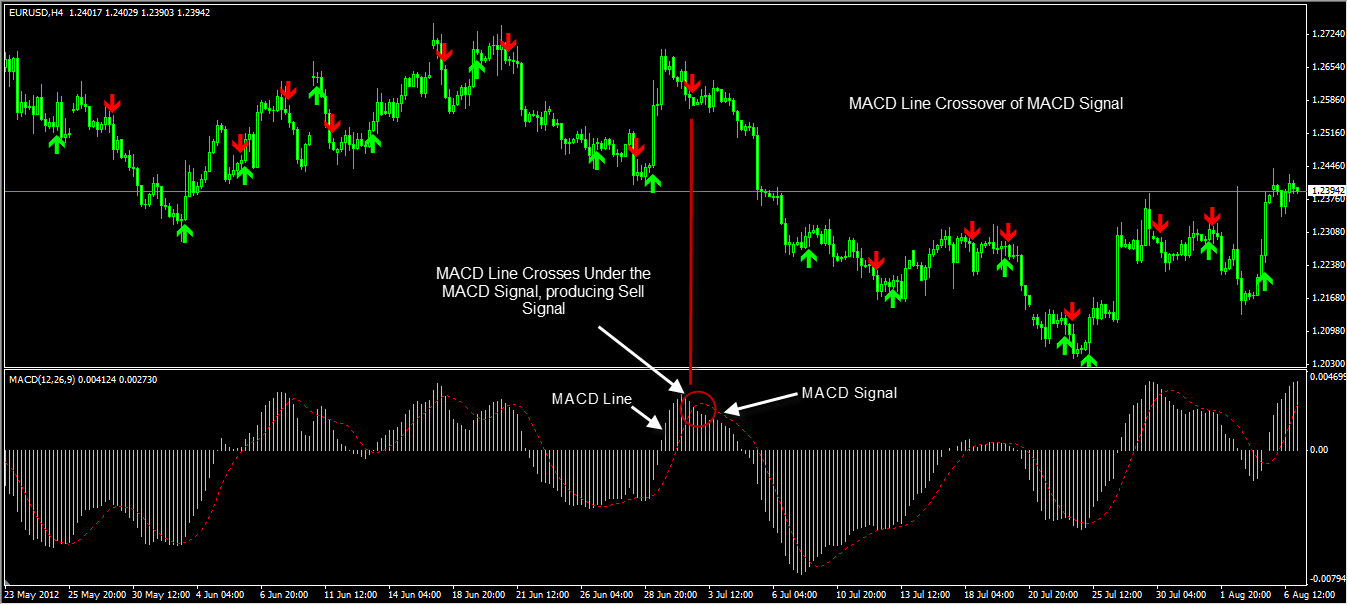
Strategy #2: MACD crossing the MACD Signal Line
When the MACD crosses over the MACD signal line, this is known as a bullish crossover, and is a buy signal. When the MACD crosses MACD signal line, this is known as a bearish crossover, and is a sell signal. Note that the MACD crossover of the MACD Signal Line significantly reduces the lag found in the 12-26 EMA crossover.
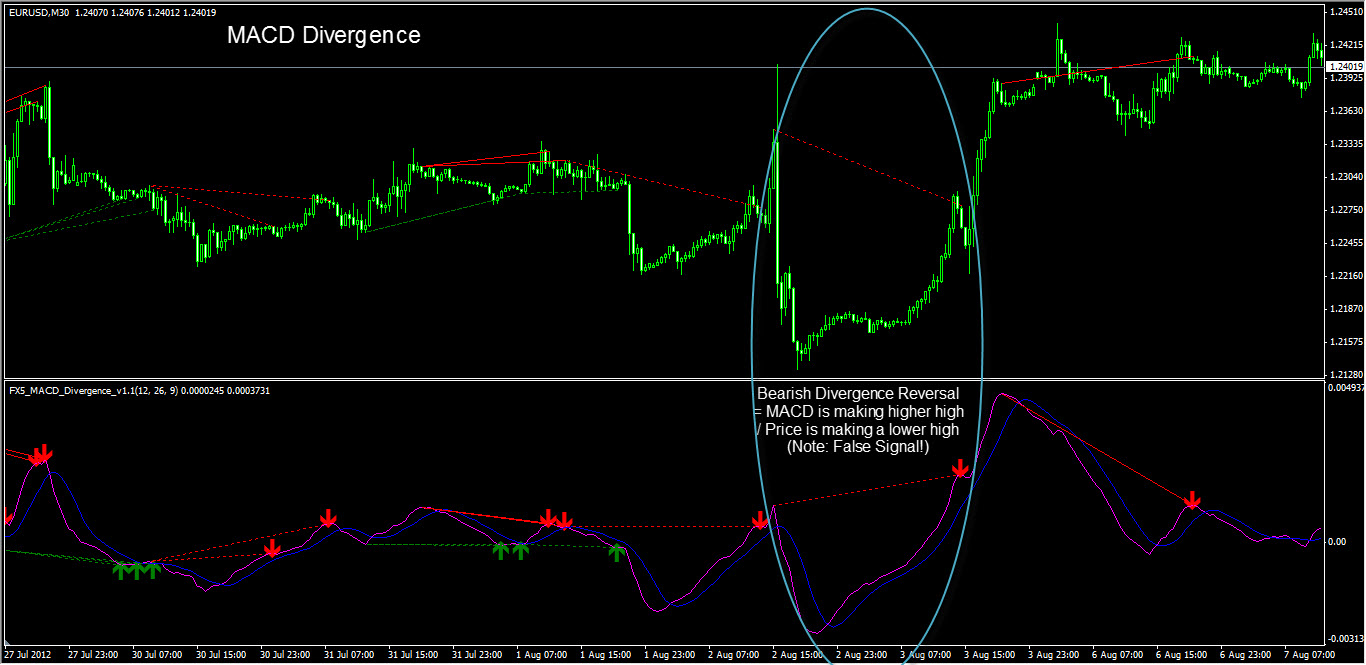
Strategy #3: The divergence between the MACD and price action.
Bullish Divergence occurs when the MACD is starting to turn up, making a higher low, but the underlying currency being analyzed is still making new lows. This Bullish divergence also occurs if the MACD is making a lower low, but the price is making a higher low. Sell signals occur when the opposite circumstances from those described above transpire.
Here is a simple table to define the different divergences:
| Name | Indicator / Price | Location |
|---|---|---|
| 1. Bullish Divergence Reversal | MACD is making a higher low / Price is making a lower low | MACD Valleys |
| 2. Bearish Divergence Reversal | MACD is making a lower high/ Price is making a higher high | MACD Peaks |
| 3. Bullish Divergence Continuation | MACD is making a lower low / Price is making a higher low | MACD Valleys |
| 4. Bearish Divergence Continuation | MACD is making a higher high / Price is making lower high. | MACD Peaks |
The bullish (or bearish) divergences are not common and often takes some study to detect but they can be detected faster with custom indicators developed below.
Conclusion
The MACD is a spin off the moving average in an attempt to reduce the problem of lag. The MACD crossing the 0 line (Strategy #1) is nothing more than the Fast (12) EMA crossing the Slow (26) EMA, and because it uses relatively shorter lengths along with the exponential calculation method, it strives to pick up the trend reversals faster than using longer lengths and simple (smoother) calculation methods. Lag is not entirely reduced, so the MACD crossing the Signal Line (Strategy #2) is an attempt to eliminate lag altogether. The MACD line (the difference between Fast and Slow EMA) crossing over the Signal Line (9-EMA of MACD line) creates a hyper-sensitive trend changer, so much so that it seems to anticipate the trend change and become a leading instead of lagging indicator. The MACD divergence strategy (Strategy #3) is yet another way to anticipate trend change before it occurs, and so followers of MACD prefer the last two strategies because they seem ahead of the curve.
But caution goes out to all usages of MACD: in striving to reduce lag and become more of a leading indicator, it courts the risk of noise, of entering into frequent false signals generated from the up and down (trendless) vacillations of the market. Because of this problem, the MACD can never be used as a stand-alone, stop and reverse system, as it will inevitably be chopped to pieces in sideways, directionless markets. Any back-test can quickly prove this point. MACD leading strategies can lead you into early trends sometimes, like the tip of the spear that points out the trend, but they can often lead you to the end of the spear the tip of which is hurtled back against your stop loss. Any attempt to try to lead or predict the markets will be punished with more noise and less reliability, for the chaos composition of Mr. Market will thwart any attempt to foretell its future intent.
The different MACD strategies can, however, be used as compliment conditions to for other indicator conditions, or even as act as an early trend change filter for an existing strategy. There are many robust EAs out there use the MACD, particularly strategy #2, as an additional condition or filter, so as to enter or exit the trade earlier than can be achieved from using moving averages alone.


 Copy Link
 Share on Facebook
 Share on X
 Share by Email