

How to Use the Momentum Indicator in Forex Trading
When torrential water tosses boulders, it is because of its momentum. When the strike of a hawk breaks the body of its prey, it is because of timing.
The Art of War
All aspiring traders know the importance of momentum. There are numerous clichés that urge traders to go with the momentum. In the 1960s, the concept of rate of change (ROC), or momentum, became popular with traders, and this popularity has lasted up to today, though it has probably been unseated to some degree by other indicators.
The Momentum indicator measures the amount (and speed) that a currency’s price has changed over a given time span, pieces of information that we can take advantage. Generally, strong trends reflect increasing momentum, whereas weakening trends reflect decreasing momentum.
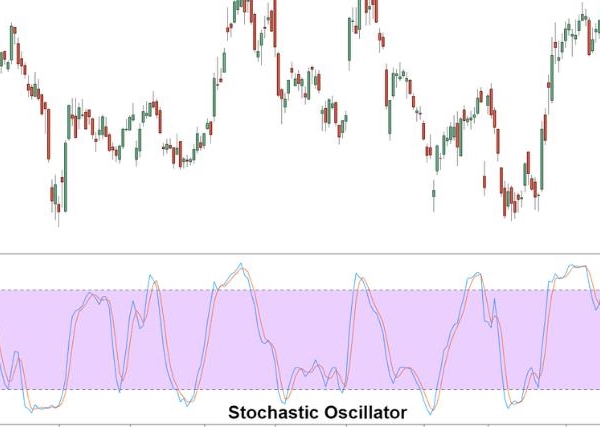
We will be discussing the original ROC momentum indicator, and not indicators commonly referred to as momentum indicators, such as Accumulative Swing Index (ASI), Advanced Decline Ratio (ADR), Aroon, Commodity Channel Index (CCI), Relative Strength Index (RSI), and Stochastics, all of which likewise track the speed of price change over time. Learn how to use this indicator in Forex trading.
Let us look at the momentum indicator found in MT4 and how it can be profitably used. Momentum is calculated as a ratio of today’s price to the price several periods ago (MomPeriod):
MomPeriod is the only variable one can customize, and it is defaulted at 14. For the sake of illustration, we will look at a daily chart of EURUSD with a MomPeriod = 5:
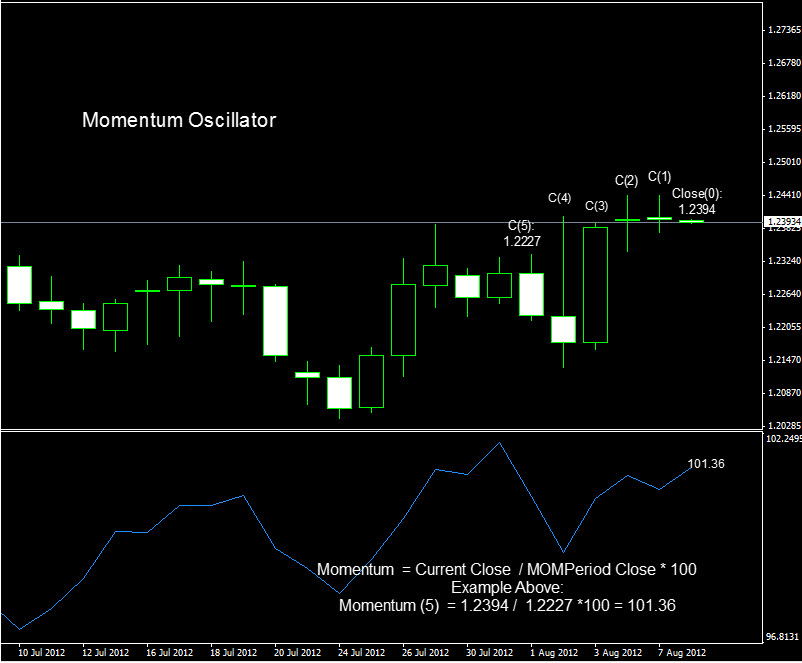
As you can see from the above chart, the current momentum is 101.36. How is this calculated? You are going to divide two closing prices: the current close (1.2394), divided by the close of 5 bars prior (1.2227), which gives us 1.0136; we then multiple 1.0136 with 100 to give us 101.36. Note that price had been travelling up, so our momentum value is above 100 or bullish; if price had been travelling down we would have had a momentum value less than 100 or bearish.
Example Above:
Momentum (5) = 1.2394 / 1.2227 *100 = 101.36
Three ways to use the Momentum indicator:
1. Momentum as a Trend-Following Oscillator (100 Line Pivot)
Bullish Signal is generated when the Momentum crosses above its 100 line and a bearish signal is generated when the Momentum crosses down the same line.
| Signal | Conditions |
|---|---|
| Long Signal | Previous Momentum < 100 Current Momentum > 100(Mom Crossing Over 100 from Below) |
| Short Signal | Previous Momentum < 100 Current Momentum > 100 (Mom Crossing Under 100 from Above) |
By itself, this strategy will tend to create too many signals to be profitable. It works best with other conditions or filters, such as the 20 SMA suggested by Alexander Elder (or any period MA deemed suitable via back-testing). For instance, if the mom crosses over 100 from below, and the close is also above its 20 SMA, then a buy signal can be taken. Reverse for the sell signal.
I would also suggest optimizing the MomPeriod for the particular pair and time frame you want to work your system upon. There are maybe other periods more suitable than 14. The default of 14 was chosen to reduce the “noise” of a volatile market without losing much of its advantage.
2. Momentum as a Leading Indicator of Exhaustion and Trend Reversal
You can use the Momentum indicator as a trend-reversal indicator similar to RSI or Stochastics and their use of overbought/oversold levels. BUY when the indicator bottoms and turns up and SELL when the indicator peaks and turns down. As there are no overbought/oversold zones of 80/20 like RSI or Stochastics to determine possible bottoms or peaks, you instead have to test for different Overbought (OB) and Oversold (OS) levels that can work out, as in the table below:
| Signal | Conditions |
|---|---|
| Long Signal | Previous Mom < 100 – OSLevel Current Mom > 100 – OSLevel (Crossing over 100 – OSLevel from below) |
| Long Signal | Previous RSI < 100 + OBLevel Current RSI > 100 + OBLevel (Crossing under 100 + OBLevel from above) |
Note: If the Momentum indicator reaches extremely high or low values (relative to its historical values), you should assume a continuation of the current trend. For example, if the Momentum indicator reaches extremely high values and then turns down, you should assume prices will probably go still higher. In either case, only trade after prices confirm the signal generated by the indicator (e.g., if prices peak and turn down, wait for prices to begin to fall before selling).
It is also a good idea to use this indicator in conjunction with a 100 or 200 period moving average. You should buy and sell in the direction of the MA trend, as you can see in the EURUSD H1 chart below:
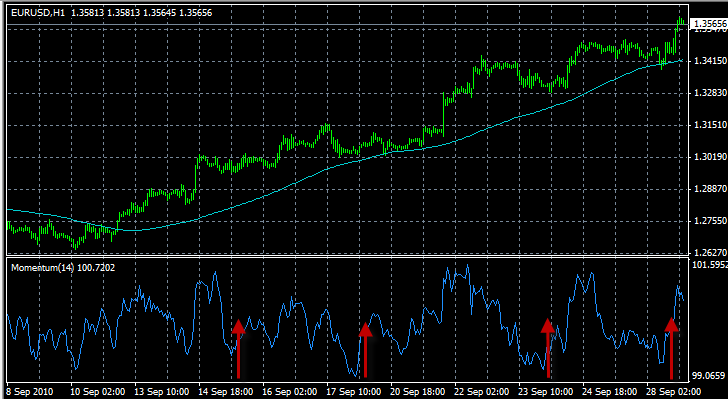
There are plotted 4 red arrows each to point out when momentum had reached relative low points (bottoms) and turned upwards in the direction of the main trend established by the 100 period moving average. If you had missed getting on board the MA direction when the price crossed above it, the bottoms of the momentum become nice alternative entry points.
3. Momentum as a Leading Indicator (Divergence).
This indicator can also be used as a leading divergence indicator much the same way as RSI and MACD can be used as leading divergence indicators.
This method assumes that market tops are typically identified by a rapid price increase (when everyone expects prices to go higher) and that market bottoms typically end with rapid price declines (when everyone wants to get out). As a market peaks, the Momentum indicator will climb sharply and then fall off, diverging from the continued upward or sideways movement of the price. Similarly, at a market bottom, Momentum will drop sharply and then begin to climb well ahead of prices. Both of these situations result in divergences between the indicator and prices.
Here is a simple table to define the different divergences:
| Name | Indicator / Price | Location |
|---|---|---|
| 1. Bullish Divergence Reversal | Mom is making a higher low / Price is making a lower low | Mom Valleys |
| 2. Bearish Divergence Reversal | Mom is making a lower high/ Price is making a higher high | Mom Peaks |
| 3. Bullish Divergence Continuation | Mom is making a lower low / Price is making a higher low | Mom Valleys |
| 4. Bearish Divergence Continuation | Mom is making a higher high / Price is making lower high. | Mom Peaks |
Let us look at such a divergence in a H4 chart of EURUSD:
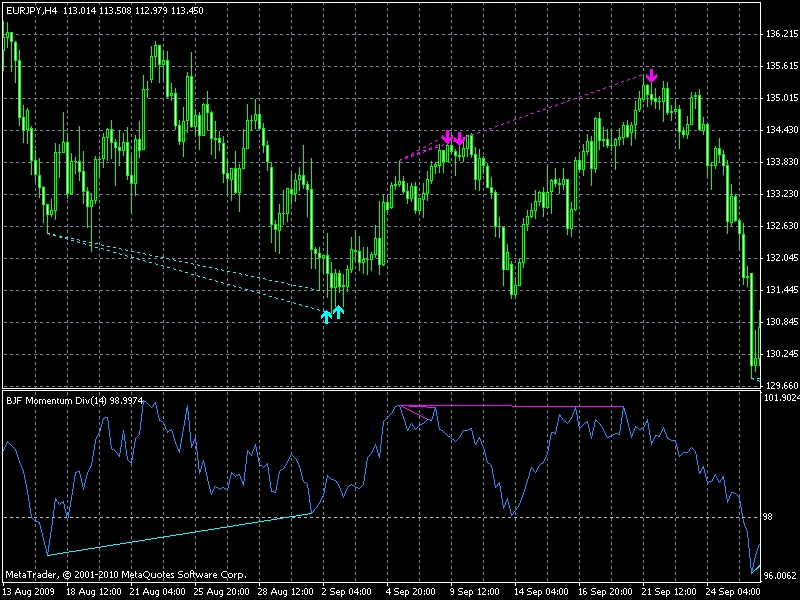
In the last buy signals in the above chart, Price had been making a Lower Low while the corresponding Mom had been making a High Low, which indicates Bullish Divergence Reversal Signal. With the sell signals, Price had been making Higher High while Mom had been making a Lower High, which indicates a Bearish Divergence Reversal Signal.
Conclusion
Momentum is perhaps the simplest constructed indicator out there. What can be simpler than taking the current close, dividing it by the close of x bars ago, and multiplying by 100. You get to see at a glance the amount and speed by which prices have changed from x bars ago. And the only variable to optimize is x, or MomPeriod.
As we have seen, there are at least three strategies that can be worked out with this type of indicator:
- taking trades when mom crosses 100;
- taking trades when mom crosses down/up through a predetermined overbought/oversold zones; and
- taking trades on mom divergences from price action.
The first strategy is the most popular of the three, so it might be the best one to start testing. But bear in mind, ROC Momentum has been unsteated in popularity by more sophisticated momentum indicators that followed it, such as RSI and stochastics. This older (simpler) version of momentum has some merit, but you have to examine each of the three strategies related to it with a degree of skepticsm: each must be backtested on different pairs across a sufficient period of historical data to determine if indeed they impart any edge factor.
You might also like to read:


 Copy Link
 Share on Facebook
 Share on X
 Share by Email