

What are Forex Pivot Points and How to Trade Them

There are major advantages when trading with support and resistance lines, and they should be a staple in every trader’s arsenal. Another effective method of deriving multiple, horizontal based support and resistance lines uses a formula derived from yesterday’s high, low and close bar. Learn in this complete article what are Forex Pivot Points, a trading strategy widely used by professional traders, and how to successfully trade them.
The formula maps out pivot point levels consisting of the pivot, and three levels of support and resistance, and these levels can be traded much the same way as trading from the regular support and resistance levels and trendlines, using a mix of breakout and bounce trading strategies.
The major advantage posited for this pivot point technique is that it is “objective,” in that so many traders are using the same levels based on the same formula. There is no discretion involved. In contrast, the method of drawing support and resistance levels and trendlines can be more subjective and impressionist (every trader can notice and draw different lines), even though there have been attempts by DeMark and others to make them more objective.
A second related advantage of using them is that because so many people are looking at these levels they become self-fulfilling. The reason pivot points are so popular is that they are predictive as opposed to lagging. You use the information of the previous day to calculate reversal points (or breakout levels) for the present trading day. Because so many traders (including the large institutional traders) follow pivot points, the market reacts at these levels, giving you an opportunity to trade them. Just like we have seen with price action support and resistance levels, traders can choose to trade the bounce or the break of these levels.
How are these levels calculated?
Here is the magic formula:
Resistance 2 = Pivot + (R1 – S1)
Resistance 1 = 2 * Pivot – Low
Pivot Point = ( High + Close + Low )/3
Support 1 = 2 * Pivot – High
Support 2 = Pivot – (R1 – S1)
Support 3 = Low – 2*(High – Pivot)
I find it is interesting that from just having the previous day’s high, low, and close you can eventually finish up with 7 points: the actual pivot point, 3 resistance levels, and 3 support levels. The three most common levels are the PP, R1 and S1.
If you hate algebra and the thought of working every day with a calculator and drawing tool to derive and plot these levels, you need not fear. The above formula is just an explanation of the theory and not something you have to calculate each and every day. There are many MT4 indicator’s that can do that for you, automatically calculating the levels and clearly drawing them for you on your chart.
There are a number of ways to trade with these calculated pivot points, and we will discuss three of them:
- Trading the Bounce from Pivot
- Trading the Break of Pivot
- Trading the Bounce from Support / Resistance (R2/S2)
Strategy #1: Trading the Bounce (Reversal) from Pivot
If you have a good idea of the general direction of the market, you can take bounce trades off the Pivot Point in the direction of where the market was relative to PP at open of day.
Many traders see the Pivot Point as the major arbiter for determining if the market is up or down. If the market starts its day above the Pivot Point, it is said to be up (bullish), and if it starts its day below, it is said to be down (bearish).
| Signal Direction | Condition |
|---|---|
| Bullish | If market is above PP at beginning of day |
| Bearish | If market is below PP at beginning of day |
Moreover, the more times a currency pair touches a Pivot Point then reverses, the stronger is the level, and pivoting simply means reaching a support or resistance level and then reversing.
Thus, using the Pivot Point as a basis for general direction, you would try to take a bounce trade when the market retests the Pivot Point.
Entry & Exit Rules:
| Entry & Exit Rules | Long | Short |
|---|---|---|
| Entry Rule | If the price starts above PP, buy at or near the PP line with market or limit order. If PP is missed, and market advances strongly up, there is an alternate trade in the long-biased PP direction: if the market is stopped at R1 or R2 and falls back to PP, you can take a long trade from a PP bounce. | If the market starts below the PP, sell at or near the PP line with market or limit order. If PP is missed, and market declines strongly down, there is an alternate trade in the short-biased PP direction: if the market is stopped at S1 or S2 and it pulls back to PP, you can take a short trade from a PP bounce. |
| Entry Rule (Conservative) | You would want the market to touch (and retouch) the line (even waiting to see how far it breaks through), and take up a trade only when the market closes x pips above the PP level, suggesting that the line held firm | You would want the market to touch (and retouch) the line (even waiting to see how far it breaks through), and take up a trade only when the market closes x pips below the PP level, suggesting that the line held firm |
| Stop Loss Rule | SL a few pips below PP, or below S1 for more trade leeway | SL a few pips above PP, or above R1 for more trade leeway |
| Take Profit Rule | TP at S2, and if it gets to S1, move SL to breakeven | TP at R2, and if the price reaches R1, move SL to breakeven |
Example of USD/JPY, Daily Pivot Levels (April 11, 2011):
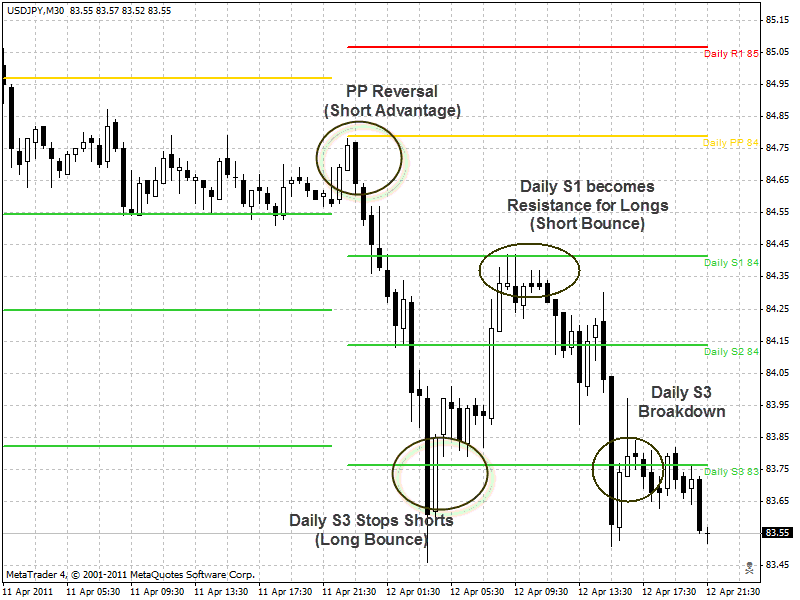
Here you have the market starting just below PP, signaling a short bias for the day, and the first bar of the day actually kisses the PP level. What is interesting is to look at the next bar after the PP level has been touched: it formed a long black candlestick to indicate that the Bears controlled the ball (trading) for most of the bar, without contest from the Bulls. It was no surprise then that the price fell down from there, for the Bears were confident that they had the ball. The market quickly fell from the PP level down through S1 and S2. Only if you had been in the aggressive mode, that is, taking the short trade near PP, after watching that Bearish candlestick (and not waiting for a contest at this line), could you have gotten aboard this trade. You would also have to be up at the open of the bar, midnight GMT, or else you would have missed it. The early bird gets the worm.
Notice how the Bulls on the retreat for the day staged a nice counterattack at S3, repelling the Bears and pushing the market back up to retest the S1 level. This is a good illustration of Strategy #3, discussed below, where one can buy the market at S2 or S3 to take advantage of oversold conditions. The Bull Bouncers at S3 would have been able to pick up a fast 70 pips if they had set a take profit 2 levels away at S1.
If you had missed the first bounce opportunity of the day at Pivot, you would have found a second opportunity to take short bounce at S1. Because Pivot held firm earlier in the day, the day was a short-biased, and because S1 was breached earlier in the day, it role-reversed to become resistance. Savvy bearish bouncers took up positions at S1 to resist the S3 Bull Bouncers, and they were easily successfully. The two bars that touched S1 formed strongly Bearish candlestick patterns: a long upper shadow indicates that the Bulls controlled the ball for part of the game but lost control by the end and the Bears made an impressive comeback.
Note: as we see in the Pivot and S1 Bounce trades, observing the behavior of the candlestick after the first touch of the level can give insight into which team controls the ball: the bottom (intra-session low) of the candlestick represents the Bears are in control, and the top (intra-session high) represents the Bulls are in control. The closer the close is to the high, the more power is credited to the Bulls, and the closer the close to the low, the more power is credited to the Bears.
The Risks of Bouncing from Pivot
The principle advantage you have in taking a bounce trade from Pivot is the direction of the day is in your favor. It is always good to have the upper hand and be able to play that hand to your advantage. However, the Pivot is a hotly contested line, and the Bull or Bear on the other side of Pivot will often try his hardest to break that line, and you have to be on guard against a potential break. If it breaks your position and your stop can be quickly overwhelmed. As we have seen you can be cautious and try to get on the bounce only after it looks like the candles forming after the touch of Pivot look to be in your favor: white for Bulls, black for Bears, with the ideal sign being a retreat from Pivot with the long shadow of your enemy. If you see the candle with the long shadow of your enemy forming, you can be sure that your enemy had been repelled from the attack, and you can get board the bounce with more confidence.
Strategy #2: Trading the Break of Pivot
The market does not always start above/below the PP and stay in that direction for the rest of the day. In fact, while you might be trying to take a bounce from Pivot, the market instead breaks it. If you were a former bouncer, you must be willing to exit your trade at the earliest opportunity, and then switch gears to take advantage of the break.
The Pivot thus marks the flag where you must be willing to switch your allegiance: you may start your allegiance depending on where the price is relative to opening Pivot, bullish if above and bearish if below. However, if the price breaks Pivot, you must be willing to shape-shift: if the price breaks up through Pivot, you must be willing to charge headlong like a bull and buy the market; if it breaks down through Pivot, you must be willing to growl like a bear and sell short the market.
If the market breaks through the pivot to the upside, it is a sign that traders are bullish on the pair, and you should start buying. Conversely, if the price breaks through the pivot on the downside, it is a signal that traders are bearish on the pair and that sellers could have the upper hand for the trading session.
Entry Rules:
| Entry & Exit Rules | Long | Short |
|---|---|---|
| Entry Rule | If price has traveled below PP and breaks up through PP, buy at market or stop x pips above the PP Level. Alternatively, if you have missed the break, you can buy the retest of the break at PP level. If the break happens too fast and there is no retest, you can take up a long position at R1, so long as momentum is strong and it looks as if it is going to break as well. | If price has traveled above PP and breaks down through PP, sell at market or stop entry x pips below PP level. Alternatively, if you have missed the break, you can sell the possible retest of the break at PP level. If the break happens too fast and there is no retest, you can take up a short position at S1, so long as momentum is strong and it looks as if it is going to break as well. |
| Entry Rule (Conservative) | If the price breaks the PP and H1 close above the level, then you can put in a buy limit order at the PP for getting in on the retest. | If the price breaks down through PP and the H1 closes below the level, then you can put in a sell limit at the PP level for getting in on the retest. |
| Stop Loss Rule | SL fixed pips below PP, or a few pips below the S1 level for more trade leeway | SL fixed pips above PP or a few pips above the R1 level for more trade leeway |
| Take Profit Rule | TP at R2. If price reaches R1, set your SL to PP level to minimize risk. | TP at S2. If price reaches S1, set your SL to PP level to minimize risk. |
Example of EURUSD M30 using Daily Pivots:
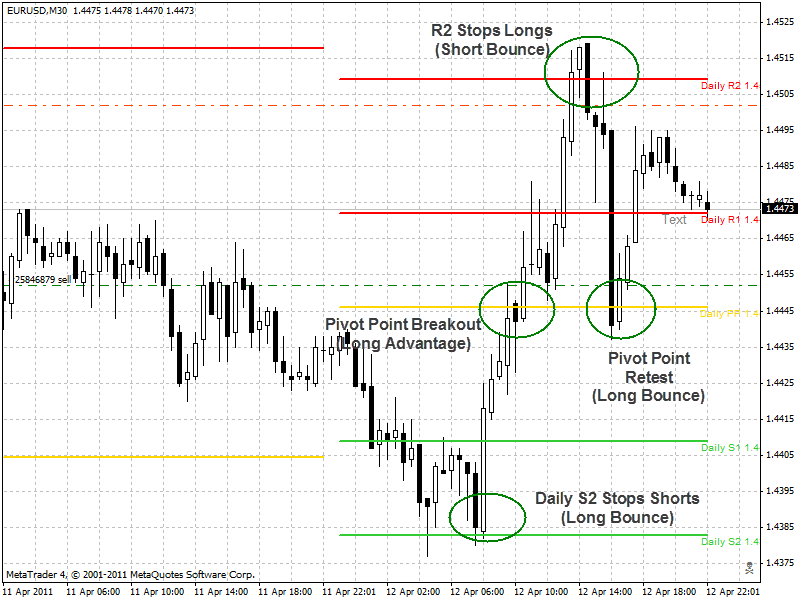
In the chart above, the EURUSD started the day below the PP level, which signaled a short bias for the day. Traders started out shorting the currency pair without waiting for a test of PP, and they shorted it till it was stopped at the S2. S2 was retested once more, and when it held firm, the Bullish Bouncers waiting at S2 drove up the market to 1.4045 Pivot, and there a short 2-hour battle was waged. The first H2 bar that reached Pivot broke through it by 10 pips, which would have given some hope to the Bulls. However, the following bar fell backwards by 25 pips, and at that moment in time, as it was falling, it would have looked as if the Bearish Pivot Bouncers had won, and that the EURUSD had been successfully rebuffed at Pivot. But that bar ended with an interesting twist if you look closely at the candlestick: the long lower shadow indicates that the Bears controlled the ball for part of the game, but lost control by the end as the Bulls made an impressive comeback. That comeback was so impressive it encouraged the Bulls to drive the market straight on through to break the PP on the next bar, and as PP was successfully breached the game was in their favor for the rest of the day. There was another 4-hour battle at the R1 level, but it was eventually knocked out as the Bulls drove the market up to R2.
Notice how the Bears on the retreat for the day staged a nice counterattack at the R2, violently pushing down the market to retest the PP level. This a good illustration of Strategy #3, discussed below, where one can sell the market at R2 or R3 to take advantage of overbought conditions (or buy at market at S2 or S3 to take advantage of oversold conditions). The short bouncers at R2 would have been able to pick up a fast 60 pips.
However, as the day was ultimately in favor of the Bulls because they had successfully broken PP earlier in the day, turning the game in their favor, the Bears gave up their counterattack at PP, and the Bulls were given another chance to get on board for a nice bounce up at PP.
Because it is particular nature and popularity the EUR/USD is a great currency to play with to take advantage of Pivot strategies.
The Risks of Pivot Breakouts:
All attempts to trade in the direction of a Pivot break have the inherent risk that the Pivot will hold firm. You don’t know whether or not the initial move through the Pivot will continue. You are waging a war with the Pivot Bouncers on the other side of Pivot, and the Fog of War is no less tricky in this scenario as it is on the live battlefield. There are feints, ambushes, and false breakouts aplenty awaiting the brave breakout foot soldier. You might enter thinking the price has penetrated successfully, only to be lured into a trap as the Bouncers engulf your position and push you back to your stop. A breakout that looks as if it had happened but did not continue onwards in the direction of the break is called a False Break–and what is false is not the break that occurred but your conclusion about its trajectory. You have to be able to quickly read the lay of the land, the candlesticks that are forming at the moment of break and soon afterward, in order to help you see how the break is materializing. If you are a Bull Pivot Breaker, you want to see solid white candlesticks forming after the break (with the ideal being the close hugging the high), and you want to be wary if your formerly white bar has shrunken like a ghost, with the close hanging down at the ankles of the low, for that is a sign that your comrades are retreating from the breach and you should be prepared for a quick exit. You also want to make sure your breakout is a true technical one and not caused by a wild move by an important news release. Spikes in volatility are common during new events, and it behooves traders to be aware of what’s on the forex calendar for the day in question.
Strategy #3: Trading the Bounce from SR Levels (Overbought / Oversold Levels)
Barring some major event or news release, few markets can advance in one direction without experiencing a corrective move. The markets travel in a zigzag course, zigzagging up and then down, down and then up. In the big picture, or longer time frame horizon, it can look like the market has steadily traveled in one direction, but under the lens of the smaller time frame, the market had zigzagged up and down repeatedly. Outside of the big trends and reversals of these trends, there are many corrective moves from the dominant trend, and one can take advantage of these.
Trading the bounce from SR levels is a strategy to take advantage of the corrective moves in the market. These SR levels are meant to hold or contain the market, and that is why they are called such. Resistance is supposed to resist the market advances, and support is supposed to support the floor against market declines.
Pivot Points gives you three levels of support and resistance, and we recommend counter-trend bounces only on the last two levels: R2/S2 and R3/S3. The price of the day is going to move fairly easily between R1 and S1, but these initial levels are not recommended for trading counter-trend bounces, given that strong reversals from Pivot can easily push the market through R1 and S1, and no one wants to be the front-line soldier defending that level against such a blitzkrieg. Only if you were certain of the overall direction of the market can you take trades at R1/S1 in favor of that general trend direction. Barring a precise understanding of the direction of the market, it is instead recommended to take up positions the R2/S2 level, because by the time the market gets to these levels, it will have been more exhausted and due for a correction. It is not recommended taking up positions at the R3/S3 levels because markets usually don’t travel that far in one day, and if they do, they are strongly trending and it is dangerous to take up a counter-trend position anyway.
Entry Rule
| Entry & Exit Rules | Long | Short |
|---|---|---|
| Entry Rule | Placed Buy Limit S2 Level, to catch oversold trade. | Placed Sell Limit at R2 Level, to catch overbought trade |
| Entry Rule (Conservative) | You would want the market to touch (and retouch) the line (even waiting to see how far it breaks through), and take up a trade only when the market closes x pips above the PP level, suggesting that the line held firm | You would want the market to touch (and retouch) the line (even waiting to see how far it breaks through), and take up a trade only when the market closes x pips below the PP level, suggesting that the line held firm |
| Stop Loss Rule | Place SL x pips below S3 to be cautious of a potential breakdown. | Place SL x pips above R2 to be cautious of a potential breakout. |
| Take Profit Rule | If long at S2, place TP 1-2 levels further up, at S1 or PP. | If short at R2, place TP 1-2 levels further down, at R1 or PP. |
Example of USD/CHF M30 with Daily Pivots:
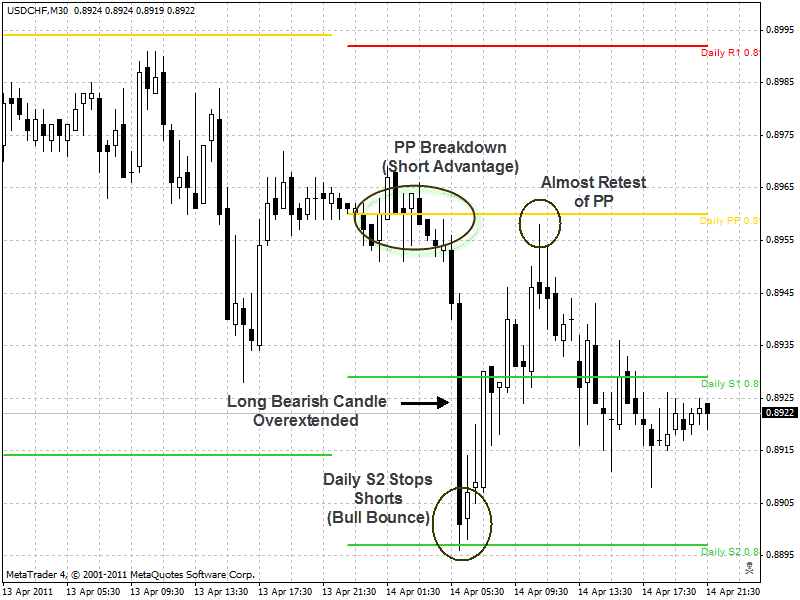
You can see from the above chart that the Bears had assumed control when the market broke through Pivot at the beginning of the day. The downward advance was swift and powerful, with one very tall dark M30 bar breaking down through S1 and attempting to test S2. I think that whenever you have one M30 bar carrying out the bulk of the decline (without any major news event propelling it), it is bound for a correction. It is like an overconfident soldier, who because he has successfully overcome one line of trenches (S1), goes on to think he is an indestructible superman who can without pause scramble the defenders of the second line (S2). Instead he throws his body on against a phalanx of bayonets. Smart bull bouncers would have waited patiently for this moment to spear the overconfident, overextended and exhausted Bearish decline. Notice how there is hardly any penetration through S2, and instead it reverses sharply at this line, with the Bull Bouncers charging the market back up through S1 to retest Pivot. A Bull Bouncer at S2 could have easily picked up 50 pips from this trade.
Risks of Counter Trend Bounces from S/R Lines
Because you are taking up bounce trades against the main trend of the day, you run the risk of the trend being so strong that your respective support or resistance level fails to hold and you are being swept away to your trending move back to your stops. You have to realize that as a risk and take your losses with your wins. You have your stops in place to limit your damage in case you are wrong. To trade without a stop is foolish as the market can keep making new highs or new lows, seeming to never retrace back to your original entry position.
Conclusion
We have seen how Pivot lines use a formula derived from yesterday’s high, low, and close bar to determine the Pivot and three levels of support and resistance. Collectively called pivot levels, the advantages to using them is that they are more objective than the impressionistic support and resistance lines formed drawn across swing lows and highs, and they are very popular, often so popular that these lines become self-fulfilling, becoming predictive of where the price will stop and reverse or struggle against.
The beauty of Pivot Lines is that they become a battle map for past and future price action. Once you insert the appropriate Pivot lines indicator onto your chart, you can see all the historic battles sites of the market (the Pivot levels bounced and broken, the support and resistance levels held and overtaken), and you can foresee where future battles in the market will be waged. Pivot lines thus give you access into the General’s tent, where you can see the armies of the Bulls and Bears being maneuvered on the map. Forearmed with this knowledge you can then profitably construct your own strategies.
The Pivot itself is the center of the action, and the Party that holds the Pivot has the upper hand of the day until the Pivot is overtaken. If the overall trend of your favorite team (Bulls or Bears) of the day is strong and you begin the day on the correct side of Pivot (above Pivot for Bulls, below for Bears), you should consider taking a Pivot Bounce Strategy. If the overall trend is still on your side but you begin the day on the wrong side of Pivot, you should consider the Pivot Break Strategy. Whether taking a bounce or breaking trade at Pivot, you should be focused on the formation of the first couple candlesticks that test the line, to see which party is winning, observing if the bars are dominant white for Bulls, dominant black for Bears, and how much shadows they leave behind. See our article on Japanese Candlesticks.
The final strategy with Pivot lines is taking up counter-trend trades along support and resistance, particularly at R2/S2. At this line, the Bulls and the Bears are going to dig in (the Bears at R2 and the Bulls at S2), defend hard, and with great probability launch a counterattack. It is sometimes nice to be on the side of the defenders and ride the wave of the counter-attack. It is not as favored a strategy as the Pivot Bounce/Break, but can be just as profitable. If the general market direction has been in your favor (it is above/below the 200 H4/D1 MA, for instance), and there is no wacky news event propelling the attackers onward other than they breached the day’s Pivot, then taking up a counter-attack at R2/S2 can have a high probability of succeeding. If you are really gutsy and you think that today’s attackers are weak and their attack short-lived, then you can even take on a counter-trend move at R1/S1, with the idea that you have just entered in a better price and position to renew what has been a larger trend in your direction and today’s attackers will probably fail to drive price to R2/S2 anyway.
 Copy Link
 Share on Facebook
 Share on X
 Share by Email