MQL4 iCustom Indicator EA
An incredible advantage in using MT4 is the use and integration of hundreds of custom indicators available online. Many can easily use a custom indicator by dragging and dropping it from the custom indicators window into your chart. Learn in this MQL4 iCustom Indicator EA article how to program the Expert Advisor to trade using a custom indicators or oscillators.
In order to use a custom indicator for an expert advisor, there are a few things you need to know.
The custom indicator that you are wanting to use for your EA must be located in the indicators directory (C:\Program Files\MetaTrader 4\experts\indicators for standard installations of MT4). When an EA is executed, it looks for the compiled indicators (.ex4 file) in the indicators directory.
There is a built-in function for working with custom indicators called the iCustom(). The iCustom() is a MQL4 function that enables you to use external indicators in your expert advisor or custom indicator code without re-writing the code from scratch.
The syntax of the function is as follows:
| Parameters | Description |
|---|---|
| Symbol | The data symbol used to calculate the indicator. NULL means current symbol. |
| Timeframe | Timeframe. Can be any Timeframe enumeration values. Choose (0) to display the current timeframe displayed on OR choose one of the following: (1, 5, 15, 30, 60, 240, 1440, 10080, 43200) {all in MINUTES} |
| IndicatorName | This is the name of the indicator file as it appears in the Custom Indicators list in the Navigator window. For example, “NonLagMA”. |
| Indicator Parameters | The Inputs tab in the Custom Indicators Properties window will show the parameters for the custom indicator. The passed parameters and their order must correspond with the declaration order and the type of extern variables of the custom indicator.They must all be separated by a comma. |
| Mode | Line index. Can be from 0 to 7 and must correspond with the index used by one of the SetIndexBuffer functions. |
| Shift | Index of the value taken from the indicator buffer (shift relative to the current bar the given amount of periods ago). |
Of the six parameters above, the easiest to figure out are the first three and last. We have already discussed symbol and timeframe in previous articles. The name of the indicator is also rather easy: it is the name of the indicator as it appears in the Custom Indicator’s list in the Navigator window, surrounded by quotation markets. Example: If you see that the indicator is called NonLagMA in the window, you will write it as “NonLagMA” in the indicator name parameter.
We have also already discussed in previous articles the last parameter, the Shift, but here is a recap. Shift indicates the bar that the indicator is being calculated upon. Bars are numbered 0, 1, 2, 3, 4, 5….as you go back in time on the chart. Changing the shift option is similar to moving the indicator line into the future or the past. Shift of 1 obtains the value of the previous bar. Shift of 0 obtains the value of the current bar.
In Sum:
- shift = 0 to get the indicator’s value of the current bar (still forming)
- shift = 1 value on the previous bar
- shift = 2 value in a bar before the previous bar
The third parameter, Indicator Parameters, and the fourth parameter, Mode, can be tricky to discover and implement within an EA.
Discovering the Indicator Parameters
First, let us examine how to discover the custom Indicator Parameters. Most of the time the custom indicator might use 1 or 2 indicator parameters, but there are some that use 3 or more, making the discovery process more difficult. The custom indicator NonLagMA is an example of a more complex indicator that uses 9 indicator parameters.
Note: Parameters are all inputs that change the value of the indicators; they are the variables that you play with to get the best set up for your custom indicator.
If you go to the Inputs tab in the Custom Indicator Properties window, it will show you the parameters for the NonLagMA custom indicator:
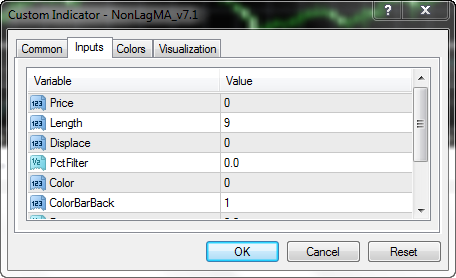
Though you can see 6 inputs in the above picture, there are actually 9 inputs or indicator parameters. There are 9 indicator parameters with different inputs you can change the value of to get the best setup, one of which is essential to the formation of the indicator (Length).
An even better method of discovering the indicator parameters is to copy and paste them from the source code. If you right click on the custom indicator and click Modify, you can see the source code of the indicator in the MetaEditor. If the indicator is grayed out it means you do not have the mq4 code, just the ex4, and you have to figure out a way to decompile it, or you can deduce the parameters from the properties window using the method above.
If you have the mq4 code and can open it, you are in luck. Now, check the extern variables at the beginning of the indicator source code. The indicator parameters, data types and default values, will be listed here, and you can simply copy and paste the extern code to the extern variables section of your expert advisor.
With the NonLagMA indicator, you will see the following extern variables:
extern int Price = 0;
extern int Length = 9; //Period of NonLagMA
extern int Displace = 0; //DispLace or Shift
extern double PctFilter = 0; //Dynamic filter in decimal
extern int Color = 1; //Switch of Color mode (1-color)
extern int ColorBarBack = 1; //Bar back for color mode
extern double Deviation = 0; //Up/down deviation
extern int AlertMode = 0; //Sound Alert switch (0-off,1-on)
extern int WarningMode = 0; //Sound Warning switch(0-off,1-on)
Bear in mind that though there are 9 parameters, only one, Length, will change the essential nature of the indicator. The others can be left at their default values, which in most cases other than Color, is 0. If we also put in 0 as the default for the last two parameters, mode and shift, we can construct our iCustom NonLagMA indicator with the above identifiers:
For the purposes of optimization, only one of the nine parameters above, Length, is the one that you will change or optimize in order to find the best NonLagMA for your currency symbol and timeframe. The others will remain at their default values. It is often the case that if you see length as a parameter in your custom indicator, it will be the one that will become the most essential to the formation of your strategy, and thus most essential for further manipulation.
The above custom indicator should compile effectively, but in order to put it in a strategy you must know how to work with the last two parameters, mode and shift.
Discovering the Mode (line /signals)
Mode is a line index that ranges from 0 to 7. MT4 allows up to 8 indicator lines (buffers) per custom indicator. These lines (buffers) must correspond with the index used by one of SetIndexBuffer lines from within the code of the indicator.
It is helpful to visual this: Your indicator has up to 8 lines/signals (or arrows) with different colors. Each line gives you an output, and each line has a value. With mode you select the line (signal) that you need for your EA (just one out of eight). Most of the time, indicators have only one line/signal so mode=0 should be used.
Note on Mode: Because MT4’s index goes from 0 to 7, mode takes values from 0 to 7. So the first signal has a mode=0 (and not 1). If your indicator has three indicator lines/signals and you want to get the value for the first line, you use mode=0, the value for the second line/signal is obtained with mode=1, and mode=2 will get the value for the third signal.
Ok, then, how do you identify the mode to use for your EA?
The mystery of the mode lies within the Indicator Buffers.
Basically, you have to look for the buffers in the code and these will become the lines of your mode. Lets say that you have 3 buffers:
If you wish to have values of 3 buffers of current bar you will write :
iCustom(Symbol(),Timefram e,”CUSTOM INDI NAME”,all parameters separated by coma, 0, 0);
iCustom(Symbol(),Timefram e,”CUSTOM INDI NAME”,all parameters separated by coma, 1, 0);
iCustom(Symbol(),Timefram e,”CUSTOM INDI NAME”,all parameters separated by coma, 2, 0);
Ok, fine, let us see an example of this buffer syntax and where it is located in the code.
Just under the initialization function of the NonLagMA indicator, you will see a number of indicator buffers that look like this:
IndicatorBuffers(6);
SetIndexStyle(0,DRAW_LINE);
SetIndexBuffer(0,MABuffer);
SetIndexStyle(1,DRAW_LINE);
SetIndexBuffer(1,UpBuffer);
SetIndexStyle(2,DRAW_LINE);
SetIndexBuffer(2,DnBuffer);
SetIndexBuffer(3,trend);
SetIndexBuffer(4,Del);
SetIndexBuffer(5,AvgDel);
string short_name;
SetIndexStyle tells us that there are three lines (DRAW_LINE). Underneath, SetIndexBuffer tells us the mode number and name of those three lines. It is these lines that begin with SetIndexBuffer that are the key to finding your mode. Specifically, the contents in parenthesis indicate the number of the mode and its name (0=MA, 1=UP, 2=Dn). There is a fourth signal (mode 3, trend) that does not have a line and is called trend. You can ignore the two buffers relating to delete (4,Del) and (5, AvgDel) as they are not signals.
Here are the 4 lines (buffers) and their signal names put into a table for you to see:
| Modes | Name |
|---|---|
| 0 | MA Signal |
| 1 | Up Signal |
| 2 | Down Signal |
| 2 | Trend Signal |
Now that we know the number and names of the lines (signals) of our mode parameter, how do we find out what they do?
One way, of course, is to have a look at the source code. However, as we have not as yet discussed the construction of indicators, I am going to assume that the code appears Greek to you.
The other method is to visually deduce the function of the lines /signals.
You need to apply your indicator to the chart and open up the data window (View /Data Window or Ctr +D). At the bottom of your data window you will see many of the signals pertaining to your indicator, along with their corresponding data values, depending on the bar your mouse is hovering over.
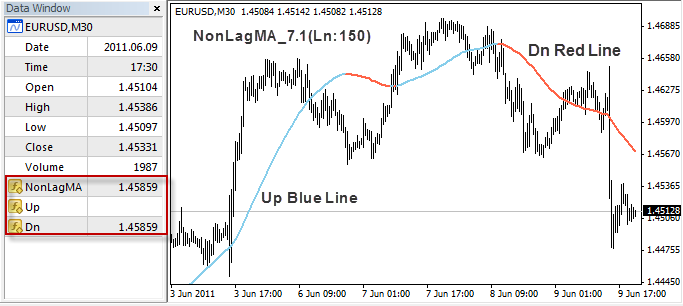
The data table that I highlighted in red provides the clue for deducing the function of the modes (lines / signals). The NonLagMA is the first mode (mode = 0), and we can deduce that it is the line itself. If you hover your mouse over any bar it gives you the data reading of the NonLagMA row for that bar. Up is the second mode (mode =1) and we can deduce that it is the blue line.
If you hover your mouse over any bar that has a blue line underneath it, you will see that it gives you a data reading for the Up row and no data reading for the Dn row. Dn is the third mode (mode = 2), and we can deduce that it is the red line. If you hover your mouse over any bar that a red line over it, you will see that it gives you a data reading for the Dn row and no data reading for the Up row.
The fourth mode of Trend (mode = 3) does not appear in the data window, though I know from looking at the code that reads like this: if current trend signal == 1, the trend is long, and if current trend signal == -1, the trend is short.
Now what you roughly know the four modes of the NonLagMA custom indicator, you can create at least three types of EA conditions:
- EA that works with the MA line itself, as in a crossover (Mode=0);
- EA that works with the Up (Blue) and Dn (Red) signals, taking buys when the NonLagMA turns blue and taking sells when it turns red (Mode=1 and Mode=2).
- EA that works with the Trend signal, buy when trend is up, sell when trend is down (Mode=3).
We will examine each of these EA combinations in the next article: Building Strategies with Custom Indicators
 Copy Link
 Share on Facebook
 Share on X
 Share by Email