What is Relative Strength Index (RSI) in Forex
Another indicator that is classified as a momentum oscillator and is simple to understand while being highly useful is called the Relative Strength Index (RSI). Learn in this complete article what is RSI (Relative Strength Index) in Forex, an indicator used by professional traders and how to read it's signals.
Table of Contents
RSI is calculated by taking the average of the closes of the up bars (the up frequency intervals) and dividing them by the average of the closes of the down bars. The RSI measures the ratio of up-moves to down-moves and normalizes the calculation so that the index is expressed in a range of 0-100. Currencies that traveled strongly upwards have a higher RSI than those that have traveled strongly down. The calculation is usually performed over the close of the last 14 periods, of any time frame.
The RSI ranges between 0 and 100, and different levels of that range will register different trading signals:
| RSI Level | Trading Action |
|---|---|
| Above 50 | Bullish |
| 70-100 | Extremely Bullish and Overbought |
| Previously above 70, now below | Short Signal |
| Below 50 | Bearish |
| 0-30 | Extremely Bearish and Oversold |
| Previously below 30, now above | Long Signal |
We will review each of these signals below.
Trading Trends: RSI Crossing the 50 Line
The simplest way to use the RSI is the crossing of the 50 line as a signal of trend direction. If RSI crosses above 50, it is considered bullish. If it crosses below, it is considered bearish. This is not the best way to trade the RSI, but it can act as a confirmation of a trend, in conjunction with other signals.
If the 50 line seems too simple for you, you may take Andrew Caldwell’s idea of defining the Bull Range as the RSI moving up between 40-80, and the Bear Range as the RSI moving down between 60-20. Charts trade within these zones all the time so it is easy enough for me to present you a simple example of such:
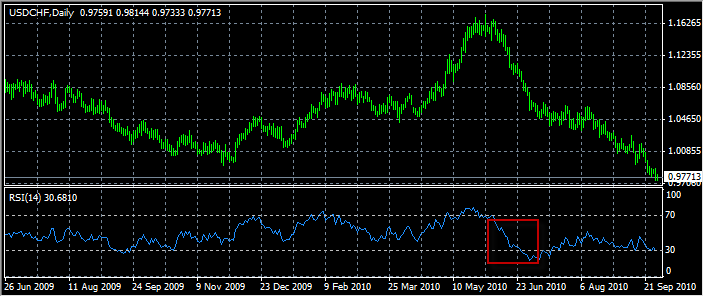
You can see by the red box how the RSI on the USDCHF daily chart was moving from 60 to 20, indicating the downward trend. This trend gets more significance due to the fact that the RSI could not remain long above 70, where the market was severely overbought.
The more popular entry system for RSI is trading trend reversals after exhaustion in the overbought/oversold regions of 70/30.
Trading Trend Reversals: Overbought/Oversold Lines of 70/30
The RSI usually tops above 70 (Overbought Region) and bottoms below 30 (Oversold Region). While it is tempting to try to trade these regions, it is advised to look at them as a pending reversal opportunity. DO NOT take reversal trades within these zones. Reason: it is uncertain how far price will continue its advance/decline, making any counter-trend trade taken within overbought/oversold zones very dangerous. Instead, one should be looking for the opportunity to take a counter-trend trade only when the RSI crosses 70 from above for short signal or crosses 30 from below for long signal. For instance, if the RSI penetrates above the 70 overbought region in a bullish phase and briefly tops at 80, but cannot continue the advance and instead falls back below 70, a short signal is generated.
| Signal | Conditions |
|---|---|
| Short Signal | Previous RSI > 70 Current RSI < 70 (Crossing under 70 from above) |
| Long Signal | Previous RSI < 30 Current RSI > 30 (Crossing over 30 from below) |
RSI period of 14 is usually appropriate, but different overbought/oversold zones can be explored, such as 75/25 or 80/20.
Here is a 14 period, 75/25 RSI on an hourly chart of GBPUSD, taken for the summer months of June and July, 2012, with short signals taken when the RSI crosses under 75 and long signals taken when the RSI crosses over 25:
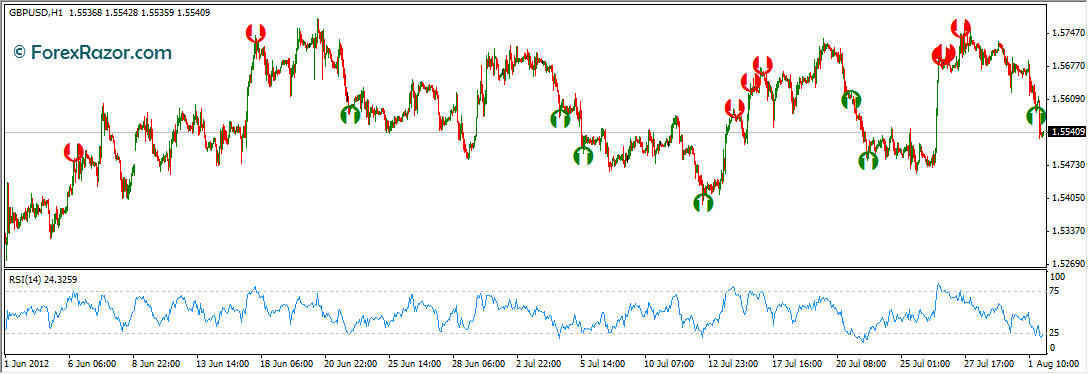
Summer months are typically range bound as the deep money traders are enjoying their vacation, so a RSI counter-trend strategy on these months could be a safe bet. With some exceptions, the signals seem to catch the market just before it reverses direction, at least for a few pips and sometimes for quite a bit more. Knowing when to exit an RSI strategy is a little tricky, and it is advised to back-test for a stop loss that is seldom hit and a take profit that is often achieved.
Here is an example from the previous month of May where GBPUSD had been continously falling, travelling in and out of the 25 Oversold Region, which would have triggered a number of buy trades that would have been stopped out:
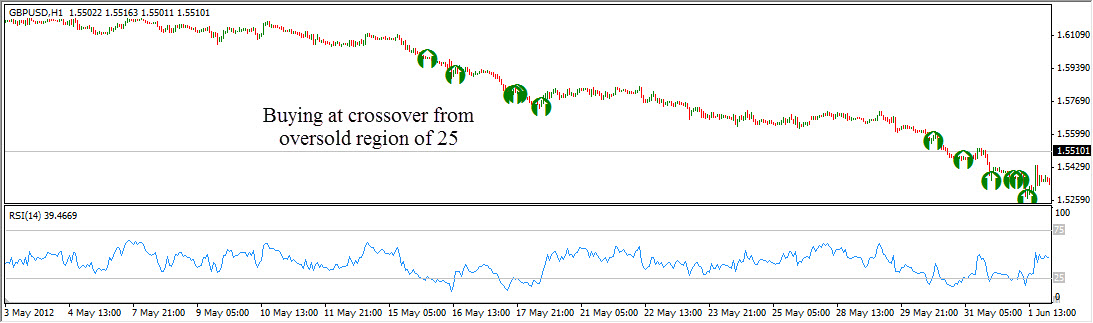
Trading the cross under/over the 75/25 lines might work well in a ranging or sideways market, but it can wither down your account when the market is strongly trending.
Chart Patterns on RSI
The RSI often forms chart patterns such as head and shoulders or triangles that may or may not be visible on the price chart.
Moreover, the RSI sometimes shows more clearly than price themselves, levels of support and resistance.
The RSI is one of the very few oscillator style indicators where trend lines and support and resistance lines can be effectively used. These are used as signals to confirm the trend shown on the price chart. When other chart patterns suggest action, then the RSI trend line might also confirm this.
Here again is the 14 period RSI on an hourly chart of GBPUSD for June and July 2012, only this time displaying a number of trendlines to assist with future action:
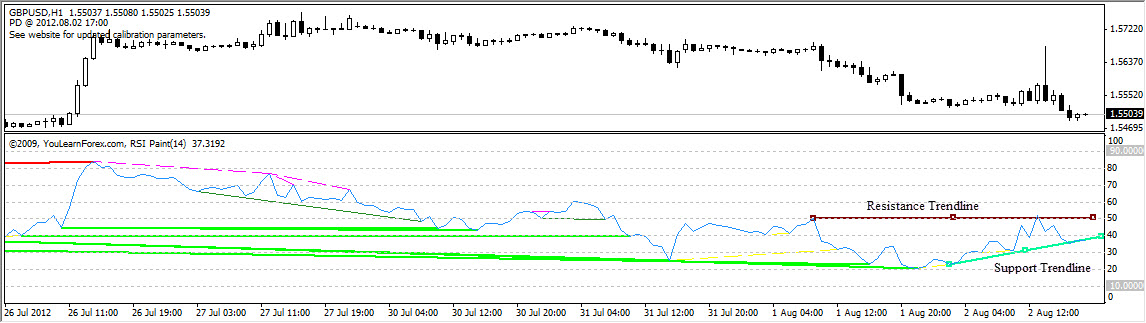
The GBPUSD had been trending south in the latter part of July and by Aug 2nd, 2012, a horizontal resistance line had formed along RSI 50 level, and an upward support trendline had formed at RSI 35. One could trade short below the RSI 35 support breakdown or one could wait to trade long above the RSI 50 breakout.
RSI Divergences
Wilder further believed that divergence between RSI and price action is a very strong indication that a market turning point is imminent. Others following him have refined his ideas.
Bullish Divergence occurs when the RSI is starting to turn up, making a higher low, but the underlying currency being analyzed is still making new lows. This Bullish divergence also occurs if the RSI is making a lower low, but the price is making a higher low. Sell signals occur when the opposite circumstances from those described above transpire
Here is a simple table to define the different divergences:
| Name | Indicator / Price | Location |
|---|---|---|
| Bullish Divergence Reversal | RSI is making a higher low / Price is making a lower low | RSI Valleys |
| Bearish Divergence Reversal | RSI is making a lower high/ Price is making a higher high | RSI Peaks |
| Bullish Divergence Continuation | RSI is making a lower low / Price is making a higher low | RSI Valleys |
| Bearish Divergence Continuation | RSI is making a higher high / Price is making lower high. | RSI Peaks |
When these valleys form below the 30% area on the RSI for possible buy signals, or form peaks above the 70% level for possible sell signals, they are most reliable. Divergence signals give the trader an advantage by confirming an entry into a downtrend as it weakens and just before it turns into an up trend. It is also used to get out of an up trend as it weakens, and before it collapses into a downtrend. The divergence signal does not occur every time a trend changes, but when it does, it delivers a strong confirmation signal that a trend break is likely.
Below is an example of Negative (Bearish) Divergence:
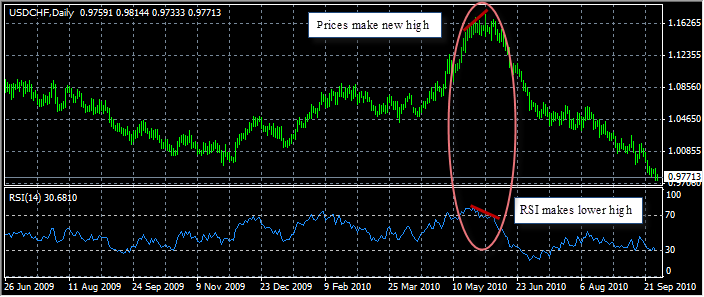
When the USDCHF daily prices made new highs culminating at 1.173 on June 1, 2010, a bearish divergence can be seen when the RSI makes a lower high. This lower high also corresponds to the failure to keep above the 70 overbought level. As you can see, divergences offer a great opportunity to take advantage of an imminent reversal.
Conclusion
As we have seen the RSI can be used in several different ways. If the RSI is traveling up and it is between 40 and 80, it is probably an indication of an uptrend. If it moves beyond 70 but cannot hold this ground and instead falls below 70, it could be an indication that the market is overbought and prone to become bearish, at least in the short term. Conversely, if the RSI is traveling down and it is between 60 and 20, it is probably an indication of a downtrend. If it moves below 30 and fails to remain below, it could be an indication that the market is oversold and poised to become bullish, at least in the short term.
One must bear in mind that these are not hard and fast rules. The RSI can be deceptive. The 70 number does not mean that a turnaround is imminent, but merely that the market has been strong. Sometimes a market will cure the overbought or oversold performance by retreating back to the direction where it traded previously. On other occasions, a market will cure the overbought situation by merely going sideways. In this situation, the overbought situation will cure itself with time at the same price level. With time, some of the strong higher market days will be eliminated from the calculating period, which may set up a situation where the price is the same but the RSI is coming down. This creates a divergence which some traders use as a set up to initiate a counter trend trade.
 نسخ الرابط
 مشاركة على فيسبوك
 مشاركة على X
 مشاركة عبر البريد الإلكتروني