

What are Fibonacci Retracements in Forex

You may have already dismissed Fibonacci numbers, retracements, and extensions as the “magic numbers” of superstitious traders. Some Fibonacci traders would have you believe that Fibonacci numbers and levels can foretell future price action almost as if it were the mysterious universal numbers that markets gravitate around.
Learn in this complete article what are Fibonacci Retracements in Forex, an indicator used by professional traders and how to plot and read it's signals.
Table of Contents
The fact is, while Fibonacci numbers and levels may not be the secret sequences or ratios found in the nature of markets, it is a very popular method of looking at the markets, and like any indicator that is popular, its relevance rests with its self-fulfilling popularity.
Many traders are buying and selling at Fib levels, and thus these levels work sometimes. This article will attempt to articulate the practical advantages of using Fibonacci levels as supplementary support and resistance levels, separating fact from fiction.
The Fibonacci Story Without the Fibbing
Fibonacci numbers, sequences and ratios are the results of work done by a famous Italian mathematician named Leonardo Pisano (his nickname was “Fibonacci”). He introduced the Fibonacci sequence in his book entitled Liber Abaci (1202), a book that introduced the Hindu-Arabic numerals used today to a Europe still using Roman numerals.
The original problem in the Liber Abaci posed the question: How many pairs of rabbits can be generated from a single pair, if each month each mature pair brings forth a new pair, which from the second month, becomes productive.
The end result is a series of numbers (the Fibonacci sequence) that when you add the previous two numbers you come up with the next number in the sequence: 1,2,3,5,8,13,21,34,55, 89, 144, etc.
When you add 1 and 2 you get 3, and when you add 2 and 3, you get 5, and so on. Each number in the sequence is simply the sum of the two preceding terms and the sequence continues indefinitely. Once you have figured out how to generate the sequence, you can solve the rabbit problem by simply reading off the 12th number: 144 pairs.
As people solved the problem in Leonardo’s book, they began to notice that this frivolous sequence of numbers occurs frequently in nature, such as the number of petals in flowers, the spirals of flowers, and the spiral path of leaves on the tree. It seemed that whenever nature created a spiral the Fib sequence was one of the most efficient ways to do it.
Then, later, like any good detective novel, mathematicians began to make a connection between the Greek’s Golden Ratio ( ) (1.618) and the 13th century Fibonacci sequence. They took the Fibonacci sequence and divided each number into the one that follows it. Here is what you get: 1/1 = 1; 2/1 = 2; 3/2 = 1.5; 5/3 = 1.666 . . . ; 8/5 = 1.6; 13/8 = 1.625; 21/13 = 1.615 . . . ; 34/21 = 1.619 . . . ; 55/34 = 1.6176 . . . ; 89/55 = 1.6181 …
When they saw the Greek’s Golden Ratio within the Fibonacci sequence, mathematicians became exited in the way only mathematicians can. They then searched for more connections, or more significant ratios.
Mathematicians began to explore, what if you divide each number by the one that follows it, and what if you divide by alternate numbers? They discovered that after the first few numbers in the sequence, the ratio of any number to the next higher number is approximately 0.618. For example, 34 divided by 55 equals .618.
If you measure the ratio between alternate numbers you get .382. For example, 34 divided by 89 = 0.382. Yes, finding ratios was a simple matter of dividing the Fibonacci sequence from left to right, then from right to left, and dividing alternates in both directions. It was a mathematician’s game that eventually becomes a trader’s tool.
Fib traders eventually agreed upon a number of significant ratios that they could use to grid the market up and down, in order to plot retracement levels and extension levels. Below are all the levels they eventually agreed upon.
Fibonacci Retracement Levels
0.236, 0.382, 0.500, 0.618, 0.764
Fibonacci Extension Levels
0, 0.382, 0.618, 1.000, 1.382, 1.618
Some Fib traders give extra glamour to the above ratios, pointing out that they are the “Golden Ratios,” and they thus have been found in nature, science, architecture, music, and art. What they fail to point out is that only 1.618 represents the Golden Ratio first discussed by Pythagoras and Euclid (with the inverse of it, 0.618, first written about in the 16th century), while the others are simply interesting ratios found within the Fibonacci sequence itself, with some (like 0.500 and 1.00) not Fibonacci ratios at all.
Moreover, this Golden Ratio, while it is found in some spirals of flowers and leaves in nature, it is by no means a universal law of nature, and while it has been flirted with by a few architects and artists in the past (with many false claims, such as Leonardo de Vinci’s use of it to proportion his Vitruvian Man or Sandro Botticelli’s use of it to proportion Venus in his famous painting The Birth of Venus), it is by no means a perfect proportion for a rectangle, pyramid, face or body, as some have assumed it to be.
Just as there is no magical or universal law to the Golden Ratio, so there is no magical or universal law within any of the Fibonacci ratios. They are simply interesting ratios discovered by mathematicians, and later adopted by traders. Traders have been allured by the seeming magic and gravity of the Fibonacci ratios in the markets, and because many do buy or sell on these levels, they become a self-fulfilling prophecy.
How to Plot the Fibonacci Retracement Levels on a Chart
Well, you don’t really need to calculate all the above numbers manually. That would be too time consuming. You can have your charting software do the work for you. Or, better still, there are MT4 indicators that you can use to plot these levels.
Using the Object Tool in MT4 (Tools/Fibonacci/Retracement)
In order to find these retracement levels using the Fibonacci object tool in MT4, you have to find the recent significant Swing Highs and Swing Lows of the chart and time frame in question.
Note: In terms of time frame, it is probably best to keep with the higher time frames, such as H4 and Daily, as these give you a bigger picture of the action and where the best swing lows and swing highs are.
For an Uptrend: click on the Swing Low and drag the cursor to the most recent Swing High.
For a Downtrend: click on the Swing High and drag the cursor to the most recent Swing Low.
Definition of Swing Low and Swing High:
- A Swing High is a candlestick with the high of that bar being higher than the high of a certain number of bars before and after it.
- A Swing Low is a candlestick with the low of that bar being lower than the low of a certain number of bars before and after it.
Note: Swing high and swing low bars can be used to calculate trendlines, support and resistance lines, and pivot points, and even Fibonacci levels.
Let us look at a EUR/USD H4 chart of April 12:
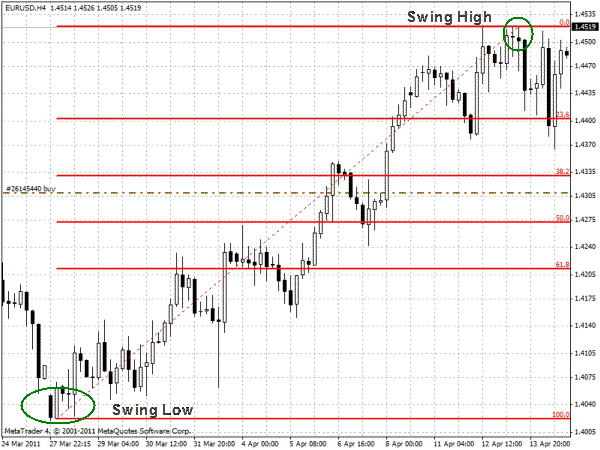
You can see here H4 low (1.4020) on March 27 was the Swing Low, for it was lower than the low of the bars before and after it, and the HH4 high (1.4520) on April 12 was the Swing High, for it was higher than the high of the bars before and after it.
When we calculate the range from swing point low to swing point high it is 500 pips. The object tool in MT4 automatically multiplied this range times the Fibonacci ratio: 38.2% (0.382), 50% (0.500), and 61.8% (061.8). It then subtracted these numbers from the swing point high, giving us the Fibonacci levels. Looking at the chart on the April 13 it looks as if the first Fibonacci level, at 23.6%, stopped the initial downward move, which suggests that the trend was so strong that it reversed on the shallowest of the support levels.
Using a Fibonacci Retracement Calculator
Find the recent significant Swing Highs and Swing Lows of the chart and time frame in question. From the above examples on the EURUSD H4 chart, we have a swing low of 1.4020 and a swing high of 1.4520.
Now go to the Fibonacci Calculator and plug those swing highs and lows into the calculator.
Notice that this calculator plots the same Fibonacci retracement levels as the MT4 indicator. The advantage of our calculator over the MT4 indicator is that you don’t need the MT4 account open and running to see at a glance what the levels are.
Fibonacci Retracement Levels for Bounce Trades
If you know the market is strongly trending, you can take advantage of Fibonacci levels for possible bounce trades that revert back in the direction of the major trend.
Here are the different levels:
| Levels | Significance |
|---|---|
| 23.6% | The shallowest of the retracements. Good for taking bounce trades in very strong trending markets. |
| 38.2% | The second line of defense of the current trend, breaking this level starts to erode the underlying trend. |
| 50% | The neutral point of any retracement, it is the critical tipping point. |
| 61.8% | This is the level that has the biggest defense to rescue the main trend, and if it holds, the bounce can be huge. |
| 100% | This is the matching of the move. |
Entry Rule:
- For an Uptrend: you buy at a retracement of Fibonacci support level.
- For a DownTrend: you sell at a retracement of Fibonacci resistance level.
The tricky part, of course, is to figure out which level you want to consider the bounce from. There are more opportunities at the first level (0.236%) and second level (0.382), but the trade off is that they are the more risky trades: in a serious corrective phase, these are the levels that can most easily break. You want to be very sure that the market is seriously trending and momentum is very strong before you consider these initial two levels.
The levels that have more backing to them are the third (0.50%) and fourth levels (0.618), with the fourth level being the strongest of them all (the inverse golden ratio), but the trade off in taking bounce trades on these levels is that they are not as often touched.
Uptrend Example
Let us have a look at what happened to EUR/USD H4 on April 19, after we plotted our Fibonacci levels (as above) on April 12:
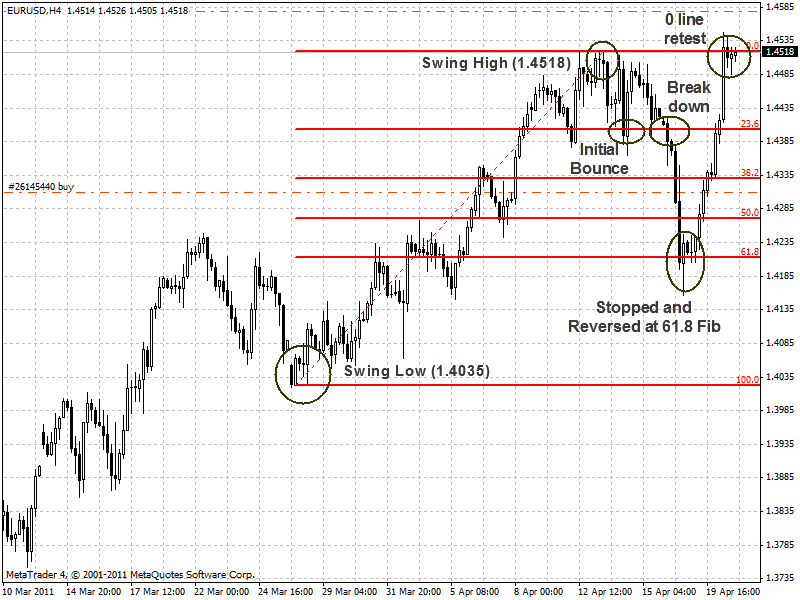
Notice that while on the April 13th the first level (23.6%) seemed to stop the Bear’s corrective move, and provided some bounce for the Bulls. If you had taken your profit near the Swing High, you would have pocketed 50 pips or so.
However, eventually that first level was broken on the downside on April 18, and the break was powerful enough to carry it down through two additional levels (38.2% and 50%) until it finally poked its head through the last level (0.618), but could not quite manage a break of it. If you had taken up defenses at level 2 or level 3, you would be badly beaten up in this downward move.
The example above is a good reason why one should not put in limit orders at the levels themselves, without waiting for other reversal confirmations.
If you had waited patiently for the retracement down to the fourth level, the golden (0.618) level, the payoff would have been huge. On April 19, the H4 bar that had penetrated through the golden level ended up in the end to become a strongly bullish bar: it ended higher than its open and demonstrated a long lower shadow.
A long lower shadow indicates that the Bears controlled the part of the bar but lost control by the end and the Bulls made an impressive comeback. This would be the confirmation signal that the golden level held firm, and the bulls could then go on and stage an impressive counterattack. Eventually, the Bulls regained their courage and shot the EUR/USD back up to the 0% level, the last Swing High in what seemed like a matter of hours.
The above chart illustrates that the 0.618 level, the inverse golden ratio, is perhaps the strongest level of support for a bounce trade in the direction of a trend. Serious traders would have been patiently watching for a retracement back to that level to get into the Bullish game at a decent price.
If we look at a chart on April 21, one day later, we can see that the EUR/USD continued past the former Swing High of 1.4520 in order to make a new Swing High at 1.4648.
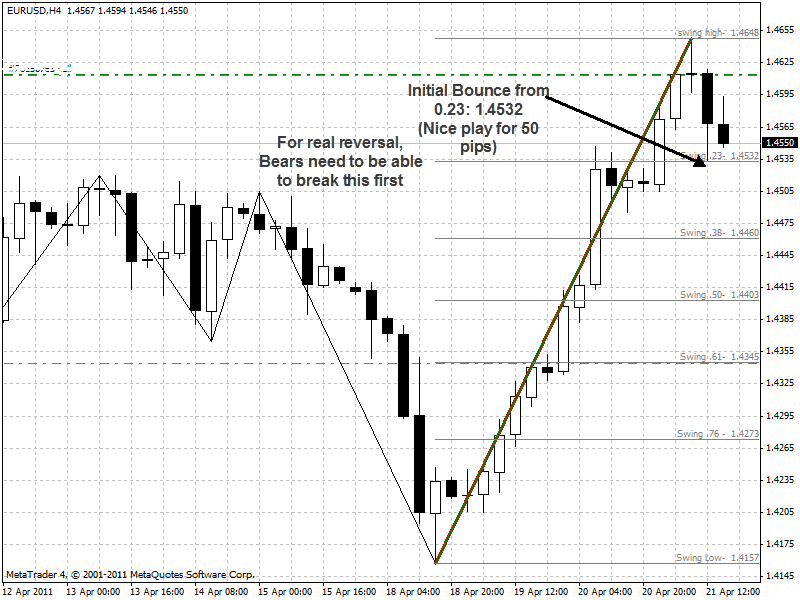
The first Fib level of 0.23 was at 1.4532, and sure enough, the market bounced from that point. Given the gravity defying 90% degree upward trajectory of the market, one could anticipate that the market is so strongly bullish that it must bounce off the first, and most shallow, of the Fibonacci support levels.
It did not bounce up far, perhaps 50 pips or so, but that would have been enough pips for many who take up bounce trades at the first level. The market is still strongly bullish and there is no doubt that Bulls are taking up positions along different levels of the Fibonacci grid. There is no telling if the first level will hold or break, but if it eventually breaks, any of the lower levels would be a fair enough place to take a bounce trade.
Downtrend Example
USD/CHF has been a downtrend for many months and thus a good candidate for a Fibonacci scenario in a downtrend. Below is a H4 chart of USD/CHF on April 21. The same day that the EUR/USD had its big move up (above), the USD/CHF had its big move down.
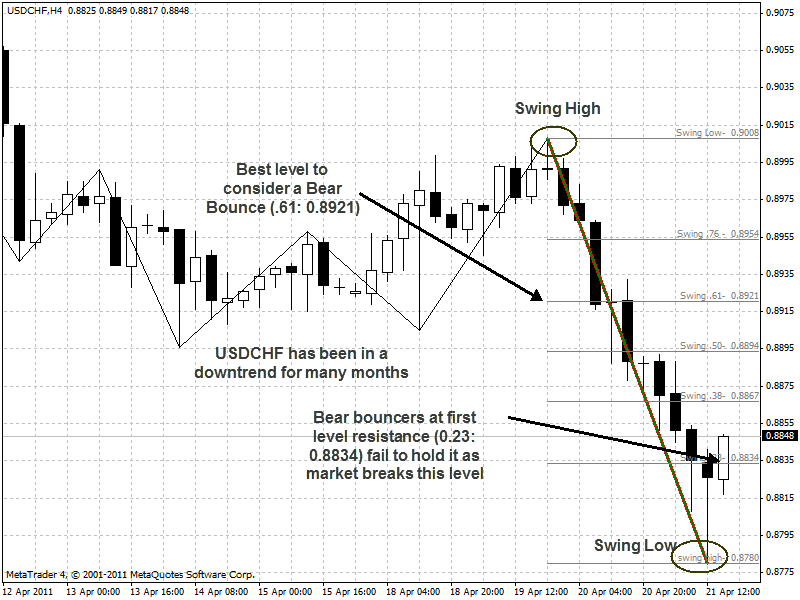
The expectation for a downtrend is that if price retraces its Swing Low, it will encounter resistance at one of the Fibonacci levels because traders will be ready and waiting to sell at these levels.
Notice how the first Fib level, at 0.23 (price: 0.8834) fails to provide strong resistance to the USD/CHF correction, whereas that same level did provide support for the EUR/USD. Sometimes it is hard to know if those first levels will hold or break. Fib traders at the first levels usually put in smaller position sizes than at levels further away.
Also, it is not a good idea to simply put a limit entry order in at these levels. It is also useful to gather confirmation signs that the level is holding. You want the candlesticks to demonstrate that the Bullish attackers are weakening. In the above case, the candlestick that breaks the initial level appears to be very bullish, indicated by its long white bar. At this point the corrective phase of the market has the power to break this first level and perhaps even the second level.
If one were really wanting to get into this Bearish market trend, the most ideal place to take up a Bear bounce trade would be at the inverse golden ratio, 0.61 (price: 0.89231), if the market eventually gets back up there, and if long as one can see signs of weakening Bull candlesticks at this higher level.
Risk of Bounce Trades from Fibonacci Levels
You should always keep in mind that price won’t always bounce from the Fibonacci levels. Sometimes they break, and if you are simply waiting there at each level, your account can be broken as well. Markets do not always trend in the same direction forever, for sometimes there are a strong trend reversals like tsunami waves that can swallow up all the Fibonacci support and resistance levels, destroying all the defenders at these levels.
You should be on guard against a potential reversal and put your stops in at all times to prevent your account from blowing up. Sometimes price may hit the 50% or the golden 61.8% and turn around, as expected, but sometimes the price will ignore these levels as if they never existed, breaking through them with extreme force.
Setting Stops at Fibonacci Levels
Traders can use the Fibonacci levels to determine their stop loss.
If the trader is buying at a Fibonacci support level, for instance, and the support level is violated, with the prices breaking down below that level, the reason for the trade is negated, and one should consider closing the position.
Your stop could be x pips below/above the level at which you are bouncing from, depending on how much breathing room you want to give the trade. You want to be able to get out when it is clearly seen that the level is broken, but you want to get out immediately (or when the level has been penetrated) just in case it turns out to be a false break.
Mitigating the Risk with Candlesticks:
When you are looking at a corrective phase in the market, and you want to take bounce positions at Fib levels, you will be looking for weakening candlesticks of the opposing team. If it is a downtrend and the Bulls are on the corrective counter-attack, you want to see that the candlesticks forming at the Fib levels have lost much of their whiteness and are even showing long upper shadows, indicating that they are losing control of the battle for the bar, which at a Fib level would signify that the Bulls are losing control over the battle for the level.
Finding Profit Levels via Fibonacci Extension (Expansion)
Once we find interesting levels in which to enter the market using Fibonacci retracement levels, the next question is: what kind of move is the market expected to make? Projecting the price move beyond the swing points is the answer every trader tries to seek.
The Fibonacci Expansion tool can be found in MT4 (insert/Fibonacci/ Expansion).
You then drag the tool from the recent Swing Low to the most recent Swing High. This time when you drag the extension tool across over these levels, you will see that market has been gridded above the Swing High, instead of being gridded in the range between the Swing Low and High.
You will get these levels: 0.618, 1.000, and 1.618, and they are used to set your take profit. After placing orders at the different Fib retracement levels, one can simply place a take profit at one of the above three extension levels. There is a high probability that traders will be looking at the 0.618 extension as the primary target to lock in profits. If the market is strongly trending, and momentum is very strong, traders can reset their take profit further out to the next level, 1.00, or even 1.618.
Earlier we showed you the retracement levels of the EURUSD that had been calculated from H4 Swing Low (1.4020) on March 27 to the H4 Swing High (1.4520) on April 12. In the following days, it was shown that the market briefly bounced up from the first retracement level (23.6), but that the bears were in control till they found steadfast resistance at the golden level (61.8), at which the Bulls launched a massive counter-attack in resumption of the main trend.
If one had been lucky enough to get in on this trade at this level, one would wonder where to put the take profit. Would it be at the last Swing High? But what if the last Swing High gives way, then where can one put a take profit?
Well, if one were to take the Fib extension tool and click on the same Swing Low (1.4020) on March 27 to the Swing High (1.4520) on April 12, one can see that the extended levels above the Swing High in which the market can move towards.
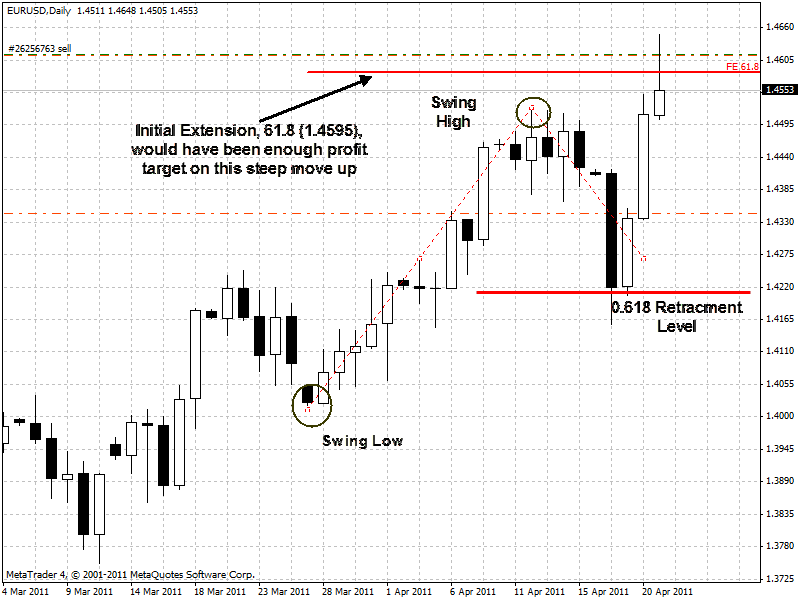
The retracement levels are not plotted-in on the above chart except for the 0.618 Retracement level, the one which the Bulls successfully bounced from, in order to avoid clutter. You can see that the extension tool used the same two Swing Points that generated the retracement levels as it did to generate the extension levels.
The initial extension level of 61.8 (1.4595) turned out to be the best bet thus far for the Bulls to have taken profit. The market did make a brief high of 1.4648, but by that time it was a little too overextended, having traveled up too far, too fast.
Wrap Up: The Golden Mean
So far, we have been uncritical of these Fibonacci retracement and extension levels, taking them for granted as levels which hold more weight and validity than random percent levels.
If we were to don the skeptics hat, we would voice three counter-arguments to Fib levels:
Fibs ratios are interesting for Mathematicians but completely arbitrary for the markets.
When you strip away the Hollywood glamor of the Fibonacci ratios, separating fact from fiction, you get a number of ratios that are interesting to mathematicians and those wanting to count flower spirals, but outside that arena, you have traders in love with these ratios because of their ancient and “mysterious” pedigree to the golden ratio of 61.8. Even if we reject the ratios on rational grounds, we are then told to embrace them on populist grounds: we must follow them because so many others following them. Is that he herd game we want to play?
Multiplicity Creates Duplicity:
Because there are so many Fibonacci retracement levels, one of them is bound to work out. Put another way, you grid the chart with 4-5 levels, and you are bound to perceive that one of them has contained price action. You could have created your own arbitrary ratio of levels 4-5 deep, and put them down on the chart, and you may see that the price stops and reverses just as well at these levels.
Interpretation Bias of Counting only Hits and Ignoring Misses
Once we become fascinated with Fibs, we tend to see all the times when they work, ignoring all the times when they don’t work. Maybe we should be posting charts for every time fibs does not work. Maybe the best way of proving the “system” is to disprove that it actually works. We should be trying hard to look at the flaws of the system instead of where it succeeds.
Answer to the Skeptics: Fibonacci levels work sometimes because of their self-fulfilling prophecy.
Sure, most of us are rational enough to know that they do not work because of their universal presence in nature or the markets. And yes, the initial reasons for why these levels were used by traders in the markets may be without much merit, but when more and more traders started buying and selling at these levels, these levels began to take on more significance than random ratios one can flip a coin upon.
We do need to be aware of the fact that we are drawing many levels on the chart, one of which might stick. Fibonacci levels by themselves may not give much of an edge. But if there is a confluence between the Fibonacci levels and other support and resistance tools, such as trendlines, and SR lines derived from price action and pivot points, then that confluence can lend even greater weight to any one of the Fibonacci levels.
Also, we must be on guard against the interpretation bias, and be ready to see the potential of any Fibs level going wrong as right, any level to break just as well as hold. That is why we are demanding additional confirmation from the candlesticks, and be willing to put in a reasonable stop loss if proved wrong.
In sum, it behooves us to follow the path of the Greek’s “golden mean” in relation to trusting in the Fibonacci levels: we must be very skeptical of their underlying significance and ability to hold at any given level, just as we must be willing to trust that these levels can be more powerful than any random level.
It is hard to discount the fact that thousands of traders do plot and watch these levels, waiting for the price to retrace back to them before initiating bounce trades in the direction of the main trend, and if that is following the herd, we traders will do it if it can make us money.
 Copy Link
 Share on Facebook
 Share on X
 Share by Email