How to Calculate Pivot Points
 John Lee Rossi
Updated 01 February 2021
John Lee Rossi
Updated 01 February 2021
In this article we will cover the different pivot point calculation methods and formulas and some of the trading strategies to apply.
Learn to calculate the pivot point manually with Standard, Fibonacci, Camarilla, Woodie and DeMark’s formulas, or use our accurate online PP calculator. To start off, let's go over the definition of pivot points, and their calculation formulas.
How to Calculate Pivot Points
What are Pivot Points in Trading
The pivot points calculation in online trading is a common practice with intraday traders and scalpers. Pivot points are horizontal levels drawn on a trading chart and calculated by a mathematical formula. These price levels are valid for the entire day, or trading session.
Calculating the pivot points in a price chart is quite simple and this strategy is a powerful tool, good for any financial market, including the Forex market. The standard, or floor, calculation of the pivot points focuses on the price of the day before, or even up to 3 days before.
There are also different calculations methods, apart from the Standard. Different calculations, and results, are obtained with the Woodie and the Fibonacci formulas, and also with the ones developed by actual traders, such as the Camarilla formula, developed by trader Nick Scott and the DeMark formula, also created by a trader, Thomas R. DeMark.
Still, all the different formulas share the same concept. A middle pivot point, and above it, different resistance levels, below it, different support levels. These levels are represented by lines on the chart signalling a price level where, potentially, the market should bounce and retrace back to the PP level.
The classic, or floor, pivot points are 7, tagged as:
R3 - Resistance 3 is the third resistance level positioned above the pivot point, R1 and R2.
R2 - Resistance 2 is the second resistance level positioned above the pivot and R1.
R1 - Resistance 1 is the first resistance level positioned above the pivot.
PP - Pivot point, also called average point, which is the central level of the 7, the median one.
S1 - Support 1 is the first support level positioned below the pivot.
S2 - Support 2 is the second support level positioned below the pivot and S1.
S3 - Support 3 is the third support level positioned below the pivot point, S1 and S2.
Extra levels obtained on the Fibonacci and Camarilla pivot points calculation formulas:
R4 - Resistance 4 is the fourth resistance level positioned above the pivot point, R1, R2 and R3.
S4 - Support 4 is the fourth support level positioned below the pivot point, S1, S2 and S3.
On a price chart, traders can see these horizontal, and parallel levels, generated by the different formulas, overlapping each other and apart by an a certain number of pips, or any other measuring unit. Let's now look at how to calculate each of these methods manually.
How to Calculate Pivot Point With Standard Formula
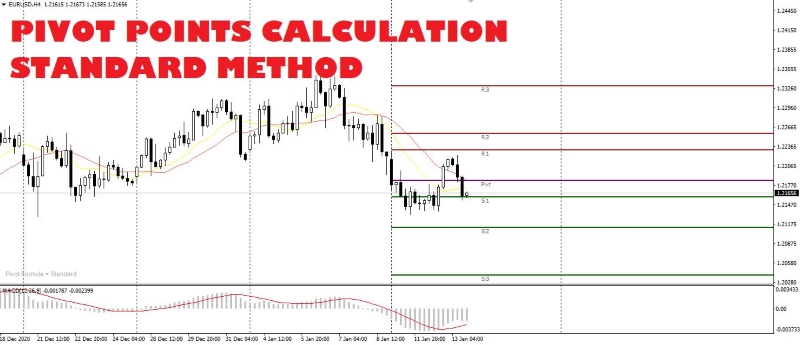
The first level to calculate is the pivot point, also called average point, because this is the base level for all the standard calculations of the support and resistance levels. Assuming that:
H = maximum price of the previous day
L = minimum price of the previous day
C = close of the previous day
To calculate the standard, or floor, pivot point levels, we proceed this way:
PP = (H + L + C) / 3
The pivot point, or average point, is thus the median price level for that day. Now let's see how to manually calculate support and resistance levels from the pivot point.
| Level | Formula |
|---|---|
| Resistance 3 | R3 = R2 + (H - L) |
| Resistance 2 | R2 = (PP - S1) + R1 |
| Resistance 1 | R1 = (2 * PP) - L |
| Support 1 | S1 = (2 * PP) - H |
| Support 2 | S2 = PP - (R1 - S1) |
| Support 3 | S3 = S2 - (H - L) |
How to Calculate Pivot Point With Fibonacci Formula
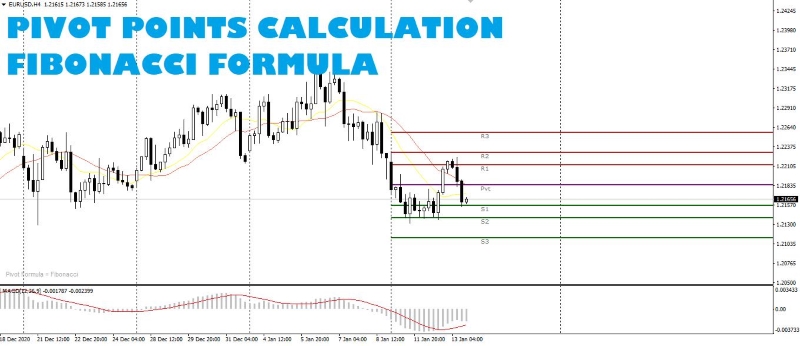
Pivot points calculation using the Fibonacci formula is a very popular one, amongst professional and institutional traders, as it is very effective to verify the price levels on a chart with mathematical supports and resistances.
To calculate the levels with the Fibonacci formula, we start with the PP calculation, similar to the floor levels calculation. Then we develop the first two support and resistance levels by applying a couple of the most popular Fibonacci retracement percentages. The remaining support and resistance levels are much easier to calculate.
| Level | Formula |
|---|---|
| Resistance 3 | R3 = PP + (H - L) |
| Resistance 2 | R2 = PP + 0,618 * (H - L) |
| Resistance 1 | R1 = PP + 0.382 * (H - L) |
| Pivot Point | PP = (H + L + C) / 3 |
| Support 1 | S1 = PP - 0,382 * (H - L) |
| Support 2 | S2 = PP - 0,618 * (H - L) |
| Support 3 | S3 = PP - (H - L) |
How to Calculate Pivot Point With Camarilla Formula
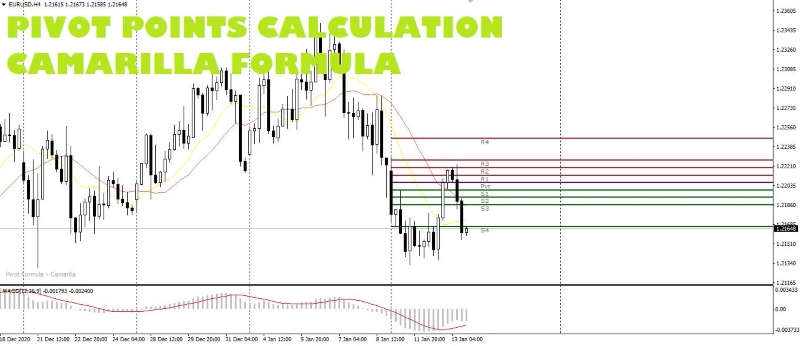
The Camarilla pivot points were first used, and developed, by trader Nick Scott, who had already made Fibonacci pivot points his mantra for calculating intraday supports and resistances.
Unlike the previous methods, Nick Scott developed the Camarilla mathematical levels with 9 pivot points. In the Camarilla formula, only the pivot point calculation is identical to the others methods.
Let's see the formulas for the Camarilla pivot points calculation:
| Level | Formula |
|---|---|
| Resistance 4 | R4 = C + [0.55 * (H - L)] |
| Resistance 3 | R3 = C + [0,275 * (H - L)] |
| Resistance 2 | R2 = C + [0.183 * (H - L)] |
| Resistance 1 | R1 = C + [0.0916 * (H - L)] |
| Pivot Point | PP = (H + L + C) / 3 |
| Support 1 | S1 = C - [0.0916 * (H - L)] |
| Support 2 | S2 = C - [0.183 * (H - L)] |
| Support 3 | S3 = C - [0.275 * (H - L)] |
| Support 4 | S4 = C - [0.55 * (H - L)] |
The decimal numbers, used in the Camarilla pivot point formula, are calculated in this way:
0,55 = 1,1 / 2
0,275 = 1,1 / 4
0,183 = 1,1 / 6
0,0916 = 1,1 / 12
Where, in that order, the denominator is the product of the previous two denominators. This shows how the creator of this pivot points formula was very interested on the study of the Fibonacci formula.
On the Camarilla pivot points trading strategy, the Resistance 3 and Support 3 levels are often used as levels to open a trade against the trend.
So, when the price reaches one of these levels, traders open a countertrend position, a short position if the price reaches R3 and a long position if the price reaches S3, with a stop loss order on the same level or on the next 4th level.
If the price travels beyond the R4 or S4 levels, this movement could indicate a price breakout. Traders will wait for a pullback, i.e., a return to that level, or the average, to open a position with the trend, a buy order after a breakout above the R4 or a sell order after a breakout below S4.
How to Calculate Pivot Point With Woodie Formula
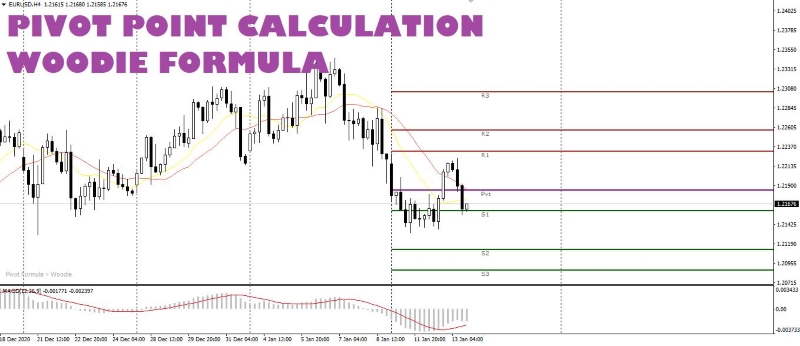
Another method to calculate the pivot points, especially when trading indices, is the Woodie method. With this method we return to the previous number of 7 levels, but there is a change in the calculation of the pivot, or average point. Here are the formulas to calculate the Woodie pivot points:
| Level | Formula |
|---|---|
| Resistance 3 | R3 = H + 2 * (PP - L) |
| Resistance 2 | R2 = PP + (H - L) |
| Resistance 1 | R1 = (2 * PP) - L |
| Pivot Point | PP = [H + L + (2 * C)] / 4 |
| Support 1 | S1 = (2 * PP) - H |
| Support 2 | S2 = PP - (H - L) |
| Support 3 | S3 = L - 2 * (H - PP) |
How to Calculate Pivot Points With DeMark's Formula
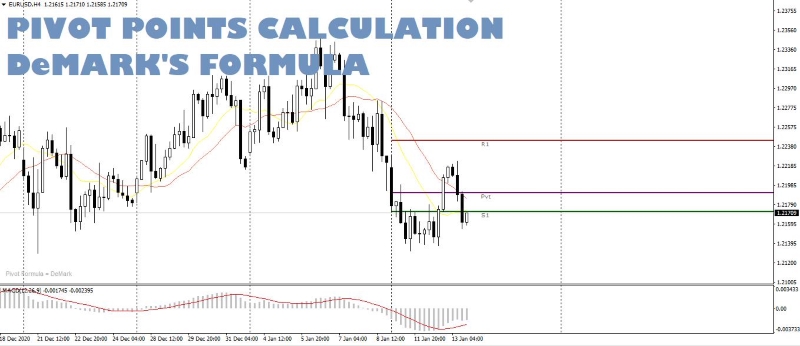
Tom R. DeMark's, member of a group of technical analysts who commit their days to scour the price charts, looking for recurring mathematical patterns, developed its own calculating pivot point formula.
His formula is the one with the least horizontal levels of support and resistance, not necessarily the least accurate. It consists, actually, of the central pivot and only one resistance level and one support level.
The difference with the other methods is that the DeMark's formula relies on the more recent data, rather than the closing prices of the previous trading day.
For the calculation of the central pivot point, with the DeMark formula, it is necessary to verify first the closing and the opening price of the previous day, i.e., check if the candlestick is a positive bullish candle or a negative bearish candle.
If the opening price is lower than the closing price of the day before, and so the daily candlestick is bullish, the calculation to do for the DeMark's pivot points are as follows:
| Level | Formula |
|---|---|
| Resistance 1 | R1 = {[(H * 2) + L + C] / 2} - L |
| Pivot Point | PP = [(H * 2) + L + C] / 4 |
| Support 1 | S1 = {[(H * 2) + L + C] / 2} - H |
Opposed, if the opening price is higher than the closing price of the previous day, and so the daily candlestick is bearish, the calculation for the DeMark's pivot points are as follows:
| Level | Formula |
|---|---|
| Resistance 1 | R1 = {[H + (L * 2) + C] / 2} - L |
| Pivot Point | PP = [H + (L * 2) + C] / 4 |
| Support 1 | S1 = {[H + (L * 2) + C] / 2} - H |
In case the opening price is equal to the closing price, forming a daily indecision candle, for example a doji candlestick, the calculation for the DeMark's pivot points is as follow:
| Level | Formula |
|---|---|
| Resistance 1 | R1 = {[H + L + (C * 2)] / 2} - L |
| Pivot Point | PP = [H + L + (C * 2)] / 4 |
| Support 1 | S1 = {[H + L + (C * 2)] / 2} - H |
Pivot Point Levels Calculator
Now that we know how to manually calculate pivot points, you're probably wonder "what if I get the calculations wrong?". Fortunately, we have a simpler solution for those looking for a quick and accurate way of calculating the pivot points, embracing the different formulas.
Simply use our specific Pivot Point Calculator to know exactly the next day pivot level and the three levels of support and resistance of several instruments, from FX pairs to crypto currencies and commodities, perfect to use in combination with your Pivot Point trading strategy.
How to Trade with Pivot Points
Generally, pivot points levels are only calculated on the price data of the previous day before the current trading session. Yet, there are traders who use different timeframes, because they might have different trading styles, or trade slower or faster that requires a different calculation from the standard daily calculation.
For those trading intraday, the previous day's calculations are fine. Traders with a slower trading style, or those who are more cautious, can opt for a calculation of High, Low and Close from 3 days and up to a week.
But for fast traders, especially scalpers, instead of calculating the High, Low and Close on the previous day candlestick, it can be an option to calculate it on the last 4 hours bar or on the last 1-hour bar. We don't recommend the use of lower timeframes.
Once the pivot points are well calculated traders need to understand how to use them for either intraday trading or for scalping. Although there are different types of formulas and methods to calculate the pivot points, this does not mean that traders have to use them all together on the same chart.
Considerations to Take into Account When Trading with Pivot Points
The PP is a median point where the price tends to return, especially in the presence of a sideways market or a weak trend.
The R1 and S1 are levels, most of the times, used as first targets in case the price bounces off the PP, and as continuation levels when they get exceeded by the price in trend. In the latter case the entry is waiting for the price to return to the pivot point, or the average, or right on top of it.
The R2 and S2 are much stronger levels that are not always reached and not always exceeded. These levels only get reached in the presence of a good directional trend and can become levels for countertrend orders, with a target towards the PP level. In the case in which the market exceeds these levels by a few pips, then the next targets in sight are the R3 or S3, with entry on a pullback placed on the same levels or on the previous ones.
The R3 and S3 are the best levels to enter the market on a countertrend order when the price goes to touch them. The target could be a huge drop down (or a huge rise up) to the PP level, but traders should always take into account the use of a divisible position to take a first profit on the R2 and S2 levels. In a fast and volatile market such as Forex, the price could also return to the trend, for example on the following day, without actually reaching the PP, and a position in profit could turn into a nightmare.
Traders should choose only one method to calculate the pivot points and start to understand if they are useful for their strategy or way of trading, and for the markets they follow. Do not make the mistake of filling the chart with all types of pivot points because you will not understand anything.
John Lee Rossi, currently head of fundamental and technical research with Clear Markets Ltd., is a seasoned trader with more than 16 years experience trading in the financial markets. John previously worked for several brokerage companies, operating in different OTC markets, specialising in a wide range of financial products, from Forex trading to commodities trading. Happily married to his lovely wife Frances, John has two teenage daughters. Away from the business, he enjoys hiking, golfing, and spending time at the Ozarks lake with family and friends.
 Copy Link
 Share on Facebook
 Share on X
 Share by Email