How to Analyze the COT Report Data in Forex

As there is no volume data available in spot forex trading because there is no centralized exchange to gather data. Professional traders have instead used the Commitment of Traders Report (COT) as a substitute for estimating forex trade positioning and price trends.
In this article you can learn how to analyze the COT data, a weekly released report with a breakdown of aggregate positions held by three different types of Forex traders.
COT is a weekly report released every Friday at 3:30 am EST by the CFTC listing current contract commitments (including Currency Futures contracts) for the prior Tuesday. The COT provides a breakdown of aggregate positions held by three different types of traders: “commercial traders” (in forex, typically hedgers), “non-commercial traders” (typically, large speculators), and “nonreportable” (typically, small speculators).
The most note-worthy of these three groups is the Non-Commercial traders (which are the large speculators, mainly hedge funds and banks trading currency futures for speculation purposes) and their net long or short positions. One can follow these guys to gauge trend strength, as they are often trend followers, and at the same time one has to be mindful that any extreme in net short or long positions can signal a trend reversal.
Trend Following Signal
When you follow the Non-Commercial (large speculators) you are generally following the smart money, the guys who are spending their careers studying the markets and pinpointing the trends. Why bother to spend all your time studying the charts and news for trend direction when you can follow the path of those who are plotting it already. If the Non-Commercial’s are net long (but not overly long) and currency price is above the 200-day moving average, then one can reasonably assume that the trend is up. Conversely, if the Non-Commercials are net short (but not overly short) and the currency price is below the 200-day moving average, then one can reasonably assume that the trend is down.
Contrarian Signal
When Non-Commercial positions enter into net long or net short EXTREME positions, it is a sign that there could be a potential reversal. Whenever anyone piles up on one side of the market, it is time for the market to change direction. For instance, when the EUR/USD nose-dived from July to September 2008, the net short positions of the non-commercial Euro Futures traders dropped as well, and when these guys started to move into extreme net short territory in September, it was time for the EURUSD to reverse in November, rising from 1.2400 to 1.4700. What is the ideal place or extreme number for take a contrarian stance? This is sometimes difficult to determine for as times change, so too does the extreme levels, so that what was considered an extreme level five years ago might not be extreme today.
Standard Source: The bulky CFTC report itself
Commitments of Traders (COT) Reports
It takes a couple steps to extract the information you want from this thing:
- Scroll down a couple pages to the “Current Legacy Report” and click on “Short Format” under “Futures Only” on the “Chicago Mercantile Exchange” row to access the most recent COT report.
- Press CTRL+F (or whatever find function on your browser) and type the currency you want to find.
- Calculate the net long or short of the Non-Commercial by subtracting the short contracts from the long.
Cons of Source:
- This report is bulky and intimidating, and it takes three steps to get to the information you need. One has to dig for information and do the calculations oneself.
- Since the COT comes out weekly, it is not so useful an indicator for short term trades.
- It is also hard to dig for and extract historical data on past positions to bring context to one’s research.
Alternative Source: FXLab’s COT
Oanda was clever enough to see a need for a more straightforward way of extracting the right information from the COT, as well as plotting it historically, and so they came up with this cool tool:
COT Forex – CFTC’s Commitments of Traders
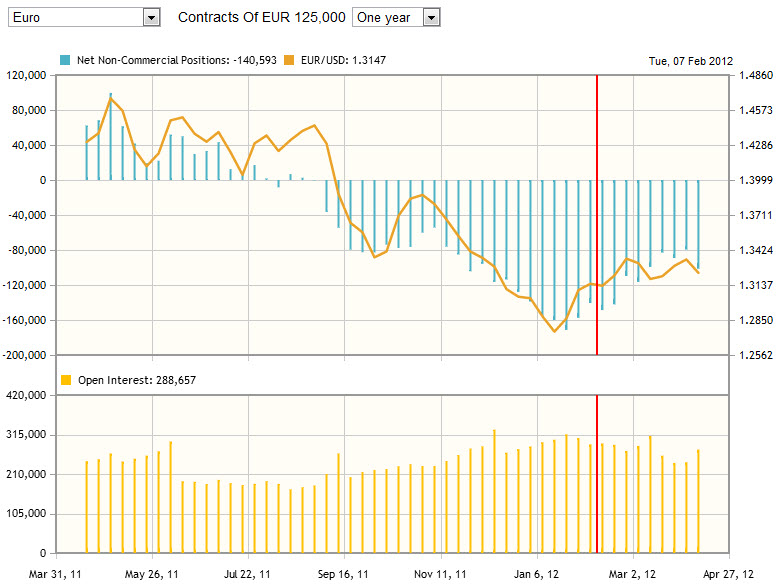
No longer do you have to undergo three steps to dig through a website to pull COT information and perform your calculations for each pair. Nor do you have to spend countless hours to find all historical COT data for each pair. This tool does it all for you. The beauty is that wherever you move the red vertical line on any week you can simultaneously see three useful things lined up together:
- the net Non-Commercial contracts;
- the currency rate value; and
- the open interest.
Pros:
- Oanda provides a needed visual graph of the changes in Non-Commercial contracts (net long and short) in relationship to rate and open interest going back as far as Jan 1, 2009.
- Oanda’s ability to cross-reference the above three items can be invaluable for traders wanting to research past levels that helped to confirm a trend or a signal a reversal.
Cons of Source:
- Oanda could have allowed the option of seeing the Net positions of Commercials and Small Speculators as well. They choose the most popular group, which is understandable.
 Copy Link
 Share on Facebook
 Share on X
 Share by Email