How to Read Fundamental Analysis in Forex

Given that we are trading currency pairs that display the relative strength of one currency against another, we must seek to compare the economic forces behind each currency within the pair. For instance, if we are looking at interest rates, we must look at the difference in interest rates, called interest rate differential, between the two pairs, not just the interest rate of the one.
Moreover, every fundamental force comparison must look at the present and past conditions, and speculate upon the short and long term future prospects. Learn how to read fundamental analysis in Forex and discover in this article the top 10 market forces that drive the currency markets and influence price.
Below are the top 10 fundamental forces that drive the currency markets.
Table of Contents
Interest Rates
Central banks enact their monetary policy by controlling overnight or short-term interest rates. They use these rates to lend money to commercial banks to influence mortgage rates and other types of loans. The monetary policy of a central bank will aim at controlling inflation and/or promoting economic growth. For instance, the European Central bank (ECB) aims at keeping inflation under 2% while the U.S. Federal Reserve has a dual mandate to promote economic growth and maintain price stability.
Impact on forex and economy
Interest rates and the monetary policy that sets them have a profound effect on a currency’s relative value and on domestic economic activity. Interest rates influence currencies directly in attracting investors to the higher interest-bearing currencies and bonds, causing the higher interest currency to go up, or scaring away such investors with lower interest-bearing currencies and bonds, causing the low-interest currency to go down. Moreover, domestic interest rates influence overall economic activity, with the lower rates typically (and sometimes only theoretically) stimulating borrowing, investment, and consumption, while higher interest rates tend to reduce borrowing and increase saving over consumption. In addition, because lower rates push down the currency price, it makes exports cheaper for foreign consumers, which in turn helps the balance of trade.
For traders, the rule of thumb is:
| Interest Rate | Currency Effect | Inflation Effect | Growth Effect |
|---|---|---|---|
| Higher Rate | Strengthens Currency | Stabilizes Inflation | Slows Growth |
| Lower Rate | Weakens Currency | Increases Inflation | Stimulates Growth |
The difference in interest rates between one country and another is known as the interest rate differential, and investors will generally be attracted to the currency pair that exhibits a positive interest rate differential. For more on this see our article on the Carry Trade.
Comparison of Current And Historical Interest Rates:
One should first try to eyeball the current differences in interest rates within each pair, paying particular attention to the pairs that exhibit the greatest positive interest rate differential. For instance, below is a ranking of the major country’s interest rates, courtesy of tradingeconomics.com:
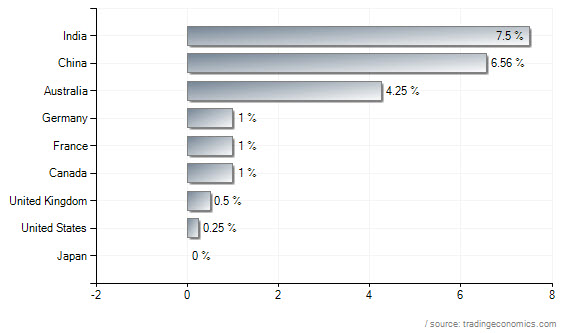
From the chart above one can immediately see that there is a big gap between the 4% positive interest rate differential between Australia’s 4.25% and United States’s 0.25%, suggesting that going long the AUD/USD (and picking up 4% per annum) would be the best carry trade.
Next one should drill down into the historical interest rates, preferably in overlayed chart format, to see the context of how the two country’s interest rates have changed relative to each other over time. Again, tradingeconomics.com shows a chart of an overlay of AUD interest rates set against USD interest rates with the AUDUSD exchange rate in the background:
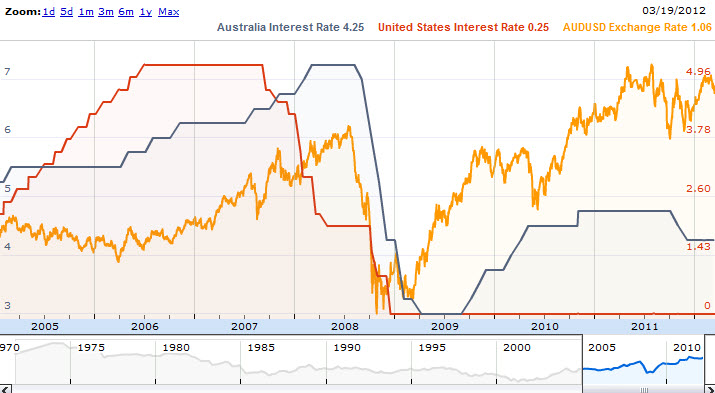
One can see from the above chart that the two rates fell dramatically in 2008, with USD falling from 5% to near zero and AUD falling from 7.25 to 3. It was not till Oct-2009 that you can see that AUD was climbing back out of its own bottom while the USD remained in the basement, signalling then to investors, that was the time to take the long carry trade on AUDUSD.
Economic Calendar: Central Bank Interest Rate Decisions and Speeches
Interest Rate Decisions
Impact: High
Countries: All
Frequency: Varies
The most significant event regarding interest rates in the economic calendar is the Central Bank Interest Rate Decisions. Here the central bank policy board makers come to a consensus on where to set the rate. Traders look closely for a difference in the forecast and actual rate, driving the domestic currency up on a higher than expected rate and driving it down on a lower than expected rate.
| Difference between forecast and actual | Currency Effect | Reason |
|---|---|---|
| Higher than forecast rate | Positive/bullish for currency | Foreign investors now want to own a higher interest-bearing currency (and bonds) |
| Lower than forecast rate | Negative/bearish for currency | Foreign investors are now less inclined to invest in a lower interest-bearing currency (and bonds) |
Central Banker Speeches
Impact: High
Countries: All
Frequency: Varies
From time to time, a central bank chairman or president may give a public speech to drop hints as to future monetary policy. He may voice concern about raising inflation, provoking speculation that he might raise interest rates to curb the inflation, or he may voice concern about the state of the economy and raising unemployment, provoking speculation that he might lower interest rates to stimulate borrowing and investment into the economy. Comments may thus determine a short term positive or negative trend. Be careful, however, as the volatility resulting from the interpretation of statements can be dangerous to short term trend traders.
Other forces that bear upon Interest Rate Decisions:
- Inflation – higher percentage changes can prompt central bankers to increase interest rates to curb inflation
- Current Account and Balance of Trade – lower numbers can prompt some central bankers to lower interest rates in order to deflate currency and increase exports
- Unemployment – higher unemployment numbers can prompt central bankers to lower interest rates to spur investment and employment.
Inflation Rates
The erosion of the purchasing power of money is called inflation. With the advent of paper currencies, and the power of central banks to lower interest rates and print at will to increase the money supply, paper currencies as a form of money are always going to burn or erode in value. The result is long term inflation, irrespective of the short term supply/demand forces on the different goods and services within a country’s Consumer Price Index (CPI), the popular measure of inflation.
However, different currencies burn at different rates of speed, depending on the level of each country’s (or central bank’s) active manipulation of interest rates and printing presses, and we as traders are interested in the different burn rates. We are particularly interested in the rate of erosion of the purchasing power of the one currency against the other that make up the pair.
Impact on Forex and Economy
Higher inflation rates in an economy decrease demand for the investments (and currency denominated in them) because all or part of any expected asset yields can be erased by the level of inflation. For instance, an investor would be foolish to invest in a 5% per year bond yield of a country that is undergoing 6% inflation as he would be losing 1% per year. Central banks keep watch on the consumer price index to see if the inflation remains in acceptable standards or is going up too much. They will potentially increase the interest rate if they fear that the inflation rate has moved above acceptable levels. More often they will decrease the interest rate (or print money) when they see that inflation levels are modest and the economy is in the doldrums. In addition, governments use the CPI to make inflation-adjusted payments to Social Security beneficiaries, government employees and retirees, and food-stamp recipients.
For traders, the rule of thumb is:
| Inflation Rate | Currency Effect (Long Term) | Currency Effect (Short Term) | Short Term Reason |
|---|---|---|---|
| Higher Rate | Weakens currency | Strengthens currency | Traders might use this surging inflation data from the perspective of a central banker so worried about it that he needs to raise interest rates to control it. Raising interest rates, in turn, strengthens the currency. |
| Lower Rate | Strengthens currency | Weakens currency | Traders might see this from the perspective of a central banker who now feels more free to lower interest rates or initiate new rounds of quantitative easing (money printing) in light of benign inflation data and a faltering economy. Lower interest rates or printing money, in turn, strengthens the currency. |
Ultimately, long term, a higher rate of inflation more quickly deflates the currency. That is obvious. What is not so obvious is that in the short-term (perhaps even for the day of the event release), a higher rate change in inflation can be positive for the currency. The reason for this is that traders will speculate that the central bank might raise interest rates to control inflation. Of course, they can be wrong, and in today’s globally shattered economy, central bankers see the flagging GDP and unemployment as more pressing concerns than inflation. What is more likely to happen is that, if there is a lower than expected inflation number, then it can give the central banker more freedom to lower interest rates, or if interest rates are already in the basement, to print more money, in order to add lighter fuel to a struggling economy.
Comparison of current and historical inflation Rates
One should first try to eyeball the current differences in inflation rates within each pair, paying particular attention to the pairs that exhibit the greatest inflation rate differences. For instance, below is a ranking of the major country’s inflation rates, courtesy of tradingeconomics.com:
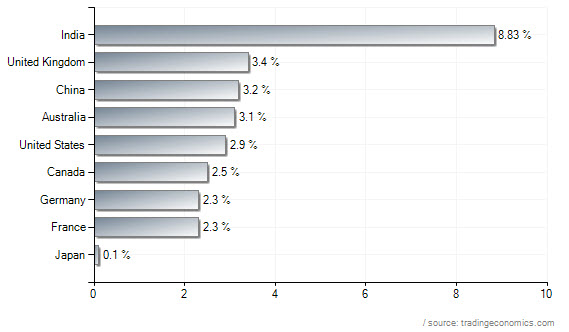
From the rankings chart above one can clearly see that the UK is major currency experiencing the greatest inflation rate of 3.4%, while Japan is experiencing the lowest at 0.1%, an inflation differential of 3.3%. What this means is that it becomes harder to justify being in a carry trade on GBPJPY when there is only a +0.5% positive interest rate differential that is more than completely erased by the -3.3% negative inflation rate differential.
Economic Calendar Events
Consumer Price Index (CPI)
Impact: Medium-High
Countries: US, UK, Japan, Switzerland, Eurozone, Leading European Countries
Frequency: Monthly
The most significant event regarding inflation rates in the economic calendar is the Consumer Price Index (CPI). The CPI is a price index which tracks the prices of a specified set of consumer goods and services, providing a measure of inflation. Different countries publish their own changes to the CPI, and traders look closely for a difference in forecast and actual rate for a short term trading opportunity, driving the domestic currency up on a higher than expected rate and driving it down on a lower than expected rate.
Core CPI
Impact: Medium-High
Countries: US, Canada, Eurozone
Frequency: Monthly
This report measures the change in the price of goods and services purchased by consumers, excluding food, energy, alcohol, and tobacco. Since the central bankers of US and Canada will focus on Core CPI (CPI minus food and energy prices) over CPI, traders will look more closely at Core CPI for inflation changes on USD or CAD.
Producer Price Index (PPI)
Impact: Medium
Countries: US, UK, Canada, Australia, Eurozone, Leading European Countries
Frequency: Monthly
The PPI measures changes in prices in goods sold by manufacturers (PPI Output), considered of low importance, and the prices of good and raw materials purchased by manufacturers (PPI Input), considered of medium importance. Since producers pass down higher costs to consumers, it can be a valuable early indicator of inflation and thus it shares the same short term and long term interpretation as the CPI.
| Difference between forecast and actual | Currency Effect | Possible Trigger Level | Potential Pip Range | Reason |
|---|---|---|---|---|
| CPI or PPI Higher than forecast rate | Positive/bullish for currency | +0.20% | 50 pips | Central bankers might see the higher inflation rate as a threat that needs to be subdued by a higher interest rate |
| CPI or PPI Lower than forecast rate | Negative/bearish for currency | -0.20% | 50 pips | Central bankers might see the lower inflation rate as a non-threat and so they can focus instead on keeping interest rates the same or lower. |
Note that an increase in inflation has a negative impact on any currency. It is thus very ironic that traders will trade up a currency due to it having a higher than forecast rate. They are only doing so because they are seeing the rate change from the eyes of the central banker, who might be threatened enough by the higher inflation to increase the interest rate in an attempt to curb it, and this increase in interest rate (if it happens) will in turn increase the demand for the currency.
Lately, as in the last 10 years, central bankers have been more concerned with lowering interest rates to fuel their flagging economies than the steadily upward (and under-reported) inflation rates that have internally eroded the purchasing power of most paper currencies. It could be argued that in the big picture, the higher CPI and PPI numbers are dangerous to the currency. The smart investors do not want to invest in a currency that is more rapidly devaluing (as seen from the CPI) and manufacturers do not want to set up plants in a country where the costs of production are higher (as seen from the PPI). One of the reasons that the Yen has been strengthening these last few years (along with Gold) is that its relatively “inflation-free environment” has been seen as a safe harbor for investors fearful about the inflationary burn rate of most other paper currencies.
Trade Balance and Current Account
Trade has evolved to become one of the most important forces shaping world economies, with the business of buying and selling products in foreign markets representing a significant percent of any large economy’s GDP. For instance, in the United States, more than 12 million jobs are tied to the exports sector, and about 25% of all U.S. business activity is linked in some fashion to international commerce. Usually, traders are interested in the “net export” figure. Exports represent a country’s competitiveness in world markets, its ability to create jobs and improve corporate profits. To satisfy domestic and foreign demand firms have to produce more and greater production translates into faster GDP growth. The downside of rising imports is that it subtracts from GDP growth since foreign companies make these products.
There are three key forces that shape a country’s trade balance: 1) relative difference in growth rates between the home country and others; 2) propensity for country’s consumers to shop for foreign goods; and 3) changing value of the home currency against other currencies. If the home country is growing faster than most other countries, imports will increase by a greater amount than exports, thus ensuring a deficit. However, some countries like the U.S. show an even greater propensity to import foreign goods than shoppers in other countries, which causes an additional problem for the US, which has been locked into annual trade deficits every year since 1976. Changes in currency values can alter the price of imports and exports and thus change demand. A stronger currency worsens the trade balance because it lowers the price of imports, making them more desirable for consumers, and at the same time, it raises the costs of goods sold in international markets, encouraging foreign buyers to look elsewhere for less expensive products.
Impact on Forex and Economy
The international trade in goods and services is a tangible way for a country to earn foreign exchange. A strong currency is built on exports exceeding imports. Net exports generate more revenue that stays in the country than goes out to purchase imports. Having more exports than imports translates into a healthy trade balance (and healthy current account) and leads to a more stable currency and economy. The more goods and services that foreigners buy from a country, the more of that country’s currency they will need to pay these products.
In contrast, a worsening trade deficit can undermine the currency. To purchase foreign goods and services, the country’s citizens must sell their currency to pay for the foreign products in their local currencies. Net imports (imports > exports) represent more money leaving the country than coming in, which leads to weaker exchange rates. It can also imply that local production of export goods has dropped and that the country has become a market for other countries to sell their products at the expense of our local industry, a situation which ultimately affects unemployment and wages and GDP. Moreover, sometimes a great appetite for consumption must be fueled by credit. To finance their huge consumption, the US has had to borrow, on average, more than 2 billion every day from foreigners, and this also weakens the dollar.
Economic Events
International Trade in Goods and Services (or Trade Balance):
Impact: High
Countries: Most
Frequency: Monthly
This report measures the difference in value between imported and exported goods and services over the reported period. A positive number indicates that more goods and services were exported than imported (more money received than spent), whereas a negative number indicates that more goods and services were imported than exported (more money spent than received).
Current Account Balance:
Impact: Medium
Countries: US, Canada, Australia, Japan, Eurozone
Frequency: Quarterly
It is the broadest accounting of a country’s trade and investment relationship with the rest of the world. One aspect of this report deals with the exchange of goods and services between the home country and others (see Balance of Trade above). But it is also broader than that. Besides selling and buying goods and services in foreign markets, there is also the import and export of investment capital. Every day foreigners buy and sell a country’s stocks, bonds, and other types of assets, and the return of investments abroad (dividends and interest payments) is income that flows back into the country. The quarterly report thus attempts to track all these cross border movements of goods and services, income flows from investments and purchases and sales of assets. The finance account shows the movement of investment capital and loans into and out of the country, including what foreign currency and securities the government owns and what other governments own of country’s currency.
Treasury International Capital System:
Impact: Medium
Countries: US
Frequency: Monthly
A report that tracks flows of investment funds entering and leaving the U.S. Since Americans love to shop beyond their means and the Federal government pays out more than collects, there exists a large gap between expenditures and income, which means that both households and the federal government have to borrow to fill the gap. Workers in Europe, Japan and China who are known to save from 5-40% of their income end up lending their excess savings to the US, purchasing US stocks, bonds and other dollar assets. This foreign lending becomes the capital the US needs to keep domestic interest rates low and economic growth to continue. Unfortunately, there will be a time when foreign creditors will find their portfolios heavily exposed to the US dollar, and they will begin to scale back and diversify into other currencies. In the economic calendar report, we will see a figure called the TIC Net Long-Term Transactions, which measures the difference in value between long-term foreign securities purchased by U.S. citizens and U.S. long-term securities purchased by foreign investors, expressed in billions. Demand for domestic securities and currency demand are directly linked because foreigners must buy the domestic currency to purchase the nation’s securities.
For traders, the rule of thumb is:
| Difference in Forecast and Actual: Current Account # or Trade Balance # | Currency Effect | Reason |
|---|---|---|
| Higher Trade Balance, Current Account Balance, and TIC Net Long Term Transactions, than forecast | Strengthens Currency | More money is coming in than going out (currency boost) and local export industry is looking more healthy (good for GDP). Any sign of a negative trade balance reversing course and begging to move closer to trade surplus is highly bullish. |
| Lower Trade Balance, Current Account, and TIC Net Long Term Transactions, than forecast | Weakens Currency | More money is leaving than staying (currency devaluation) and local export industry is looking less healthy (bad for GDP). Any sign of a negative trade balance getting progressively worse, or a positive trade balance reversing course, is bearish. |
Note: The reversal or narrowing of a negative trade balance can improve the currency only if it results from a greater international demand for the country’s goods and services. If the reversal or narrowing came about as a result of a deep recession, with import demand plummeting, investors would still shy away from the currency.
In the big picture, a positive balance of trade is known as a trade surplus and consists of exporting more than one imports (which means it has received more money than it has spent), whereas a negative balance of trade is known as a trade deficit and consists of importing more than one exports (more money being spent than received). Neither is inherently dangerous to large economies, but large trade deficits can be a sign of other economic problems. For instance, United States has been running a large trade deficit for a long time now, particularly with China, and China, in turn, reaps a blizzard of US dollar trade surpluses and reinvests it into US bonds. China’s trade strategy has been to gain as much global manufacturing share as possible, and it has accumulated a massive amount of forex reserves as a side effect of this strategy. To achieve this strategy, China has intentionally manipulated its currency, pegging it to the almost-always weaker US dollar, and as a result of this pegging and low labor and production costs, they have kept their exports cheap all over the world. These cheaper exports, in turn, have gutted American manufacturing jobs. European exporters have suffered more. With a weaker US dollar, US goods have been cheaper in Europe, but European goods have not been cheaper in either the US or China. With the US and Europe still in the clutches of the global recession, China will gain even more market share by keeping its currency peg and exporting its way to more growth.
Government Debt
Most people are not aware of how rising levels of government debt result in currency debasement. If the country has been a long time in a negative balance of trade, and its government continues to pile on the debt, the currency falls as a result. Both sides of most of the currencies we trade have governments buried in debts that are more than 70% of GDP:
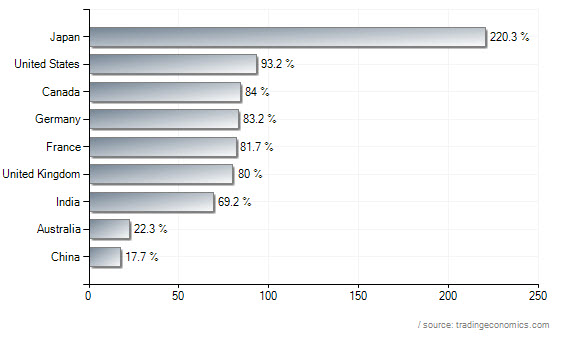
Government debt as a percent of GDP, also known as debt-to-GDP ratio, is the amount of national debt a country has in percentage of its Gross Domestic Product. The higher the debt-to-GDP ratio, the less likely the country will pay its debt back, and more likely the country is to default on its debt obligations. The highest gross Government debt as a percentage of GDP among countries tracked in 2011 was recorded in Japan (220% of GDP), but the currency weakening effect of their enormous debt has not been felt as much because they enjoy a large trade surplus. Not so for most other countries with large trade deficits and huge debt to GDP ratios. We have heard much about the sovereign debt issues of the EU, and it boils down to the fact their problem countries have an enormous debt to GDP ratios: Greece (143%), Italy (119%), Ireland (96%), Portugal (93%). Their GDP cannot keep pace with their mounting debts. Most other big economies are not far behind. The United Kingdom, France, Germany, and Canada, all have debt levels between 80 and 90% of GDP. United States has a whopping 93% of GDP (reported in other places as 103%), similar in percent to that Portugal and Ireland, but in dollar amounts it is absolutely staggering, coming in at $15.5 trillion and growing by a pace of $1.5 trillion per year. Unsurprisingly on August 5, 2011 Standard & Poor’s (one of three rating agencies) downgraded its rating of long-term federal debt to AA+, one notch below the top grade of AAA it had maintained for decades. The only two countries of the Forex Majors not plagued by a high debt are Switzerland (55%) and Australia (22%), which helps explain their superior currency performance post 2009.
Nick Barisheff has written an astute article that observes how US government debt and the price of gold are now moving in lockstep.
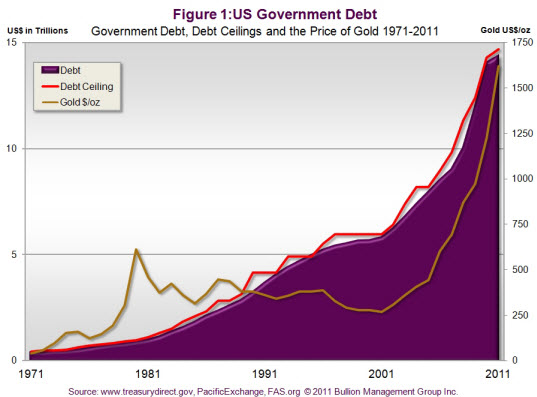
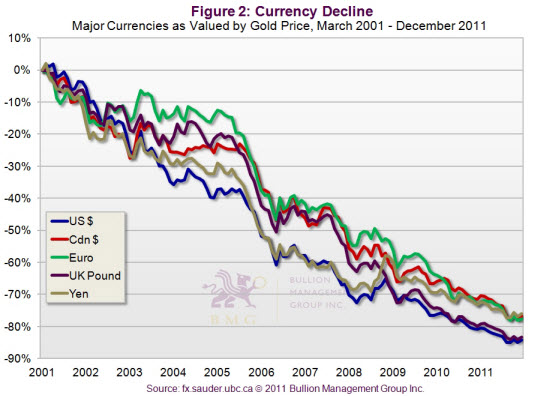
America’s debt is projected to reach $23 trillion in 2015 the price would be $2,600 per ounce, if the correlation remains the same. Most Western economies have reached unsustainable levels of debt, and their own poor debt records have been debasing their own currencies relative to gold, as this second chart shows:
Nick goes through the four possibilities of reducing government debt:
1) grow out of it through increased productivity and exports, which is unlikely;
2) introduce strict austerity measures to reduce spending, which has the unwanted short-term side effect of increasing unemployment and reducing GDP, resulting in even higher deficits;
3) default on the debt, which will make it difficult to raise future bond issues; and
4) issue even more debt and have the central bank create whatever amount of currency is needed.
He thinks that most politicians will opt for four, since few have the will to choose austerity, cutbacks and full economic accountability over simply creating more currency. Note: the US Federal Reserve, unlike the European Central Bank, can create currency without restriction.
Economic Events
Government Budget Balance:
Impact: Low-Medium
Countries: US, Canada, Spain, France
Frequency: Monthly
Budget Balance measures the difference in value between the federal government’s income and expenditure during the reported month. A positive number indicates a budget surplus; a negative number indicates a deficit. This figure should not be confused with the year-end fiscal deficit, which can be huge, or with the government’s total debt (called the National Debt or Public Debt), which results from an accumulated deficit across a number of years and can be mind-blowing enormous. For instance, the typical monthly deficit for the US is around 100 billion, a typical yearly deficit is now 1.5 trillion, while the US National Debt is 15.5 trillion and growing by millions every minute that I write this (www.usdebtclock.org). Few economies today ring out a budget surplus, either monthly or yearly. Most move into consistent and deeper budget deficits.
For traders, the rule of thumb is:
| Difference in Forecast and Actual: Budget Balance | Currency Effect | Reason |
|---|---|---|
| Positive number | Strengthens Currency | Represents a budget surplus. If a country has a high debt to GDP ratio, a positive number can be encouraging to investors in the currency. |
| Negative number | Weakens Currency | Represents a budget deficit. If a country has a high debt to GDP ratio, a negative number can be discouraging to investors in the currency. |
Employment / Unemployment
Employment represents the health of large economies where job creation is the foremost indicator of consumer spending: more workers mean more spending which helps businesses see higher revenue and fewer workers mean less spending, less revenue. Moreover, poor employment data can tell investors to remove their capital out to more favorable country (and currency) and improved employment data can lure them into pouring more capital into the economy.
Impact on Forex and Economy.
Higher employment can be a boost to the currency and economy, as investors see it as a sign of a healthy economy. More people employed means more spending, which is favorable in large economies where consumer spending represents the majority of economic activity. Moreover, traders will see higher unemployment from the eyes of the central banker who might be inclined to lower interest rates to encourage borrowing and spending and job growth. An interest rate decrease will, in turn, cause global investors to shy away from the currency and search for higher yields elsewhere.
Economic Calendar Events
There are a couple different ways to report the employment numbers:
1. Initial Jobless Claims (US) and Continuing Jobless Claims (US):
Impact: High (Initial) and Medium (Continuing)
Countries: US
Frequency: Weekly
The Initial Jobless Claims measures the number of individuals who filed for unemployment insurance for the first time during the past week and represents the earliest U.S. economic data. Continuing Jobless Claims, released at the same time as the initial figures, measures the number of unemployed individuals who qualify for benefits under unemployment insurance. Change in # (thousands).
2. Nonfarm Payrolls
Impact: High
Countries: US
Frequency: Monthly
Measures the change in the number of people employed during the previous month, excluding the farming industry. Change in # (thousands).
3. Unemployment Rate
Impact: Medium
Countries: Most
Frequency: Monthly
The Unemployment Rate measures the percentage of the total work force that is unemployed and actively seeking employment during the previous month, expressed as a percentage.
For traders, the rule of thumb is:
| Difference in Forecast and Actual: Claims Payroll # or Unemployment % | Currency Effect | Reason |
|---|---|---|
| Lower claims, higher payroll, lower unemployment than forecast | Strengthens Currency | Forecasts improved GDP (positive for currency) and less concern about central bank lowering interest rates to stimulate the economy. |
| Higher claims, lower payroll, higher unemployment than forecast | Weakens Currency | Forecasts weakening GDP (negative for currency) and more concern about central bank lowering interest rates (negative for currency) to encourage borrowing to spur economy. |
Of all the events above, the US nonfarm payrolls is perhaps the biggest event, as United States is highly dependent on the growth of new jobs to fuel its consumer spending economy. Sometimes the unemployment rate of a region can be more muted due to lag time (e.g., EU, where employment data has been coming in from member countries) or more muted due to the fact that consumer spending is not a big driver of the economy (Japan).
GDP
Gross Domestic Product (GDP) measures the annualized change in the inflation-adjusted value of all goods and services produced by the economy. It is the broadest measure of economic activity and the primary indicator of the economy’s health. Government institutions make key economic decisions based on it (such as preparing for the government budget), central banks formulate policy based on it, and the stock exchanges and business sectors depend on GDP to prepare forecasts of economic performance for production, investment and employment planning.
It is the most obvious statistic to look up when judging the present status of a world economy.
Impact on Forex and Economy
A rising GDP generally spells well for currency and economy. If production is high and translates into good revenue, the currency grows stronger as a result. However, a falling GDP or stagnant GDP can not only signal that the economy has grown weaker, but it can also lead the central bank to lower interest rates to spur more borrowing and economic activity to improve GDP. If the central bank lowers interest rates out of concern for GDP, then the currency becomes less attractive for international investors to hold and the currency weakens.
Economic Calendar Events
GDP (MoM & YoY)
Impact: Medium-High
Countries : Most
Frequency: Quarterly
This report computes the size of the economy in two ways: 1) current (or nominal) GDP tallies the value of all goods and services produced in a country using present prices, and 2) real (or chained) GDP counts only the value of what was physically produced. Did Hewlett Packard gain $100 million in 2011 from selling 10% more computers or did it gain it from raising the prices by 10%? It is vital to know if the country grew because of the quantity of products sold or whether it was a result of price spikes or inflation. We want to see real increases in economic output, which means a greater supply of goods and services available to consumers. Higher real GDP improves the standard of living for its citizens, while GDP growth due to inflation erodes living standards. Most economic calendars report the GDP figure which is the annualized change in the inflation-adjusted value of all goods and services produced by the economy, expressed as a percentage change. One must keep in mind that a real 3% (and greater) annual growth rate is considered the pace in which the economy has to grow for people to feel the economy is moving forward, and if it grows less than 3%, the economy is not growing fast enough to absorb roughly 1% per year of new workers entering the labor force and the result is usually higher unemployment. Greater than 4% GDP growth risks the danger of overheating and higher inflation and the possibility that the central bank may raise interest rates to cool down economic activity a little.
For traders, the rule of thumb is:
| Difference in Forecast and Actual % Changes | Currency Effect | Reason |
|---|---|---|
| Higher than forecast | Strengthens Currency | Economy is healthy (pro-currency) and central banker less inclined to lower interest rate. |
| Lower than forecast | Weakens Currency | Economy is not as healthy and central banker may be more inclined to lower the interest rate (anti-currency) |
Because GDP is a lagging indicator that usually comes out quarterly, traders are often looking to business related indicators (Manufacturing PMI, Industrial Production, and Retail Sales) as foreshadows of an improved GDP alongside unemployment figures.
Manufacturing Related Stats
Since GDP is a lagging indicator that comes out quarterly, traders will look to more frequent manufacturer related stats to get a faster sense of the economic vitality of a country. Though the manufacturing sector typically makes up only 20% of an economy, it attracts more attention than the service sector because the service sector grows at a fairly stable pace, regardless of whether or not the economy is weak or strong (people will always spend on medical and dental, transportation, haircuts etc). In contrast, manufacturing activity is highly sensitive to changes in interest rates and demand, and so it corresponds more closely to shifts in the economy.
Impact on Forex and Economy
When manufacturing managers are increasing their material purchases, new factory orders are being placed, and industrial production shows increased output, you have an economy revving up for production and growth. This increase in production may be the result of more domestic and/or international sales. The part that represents international sales signifies an increase in exports, which improves the trade balance and brings in more needed revenue in exchange for exports. The right balance of international trade generally influences forex rates. Increasing exports leads to high forex reserves that will eventually strengthen the currency against other international currencies.
In contrast, a decline in production automatically translates into a decline in exports, which will eventually reduce the country’s forex reserves, especially if the decline in local production may force the country to rely on imported products to meet the local population’s demand.
Economic Calendar Events
The Manufacturing Purchasing Managers Index (PMI)
Impact: Medium
Countries: US, Canada, UK, Various EU Countries
Frequency: Monthly
This Report measures the activity level of purchasing managers in the manufacturing sector. A reading above 50 indicates expansion in the sector; below indicates contraction. Purchasing managers usually have early access to data about their company’s performance, which can be a leading indicator of overall economic performance. If the report indicates a decrease in purchases of manufacturing materials, the result may be a massive decline in production activity in the days to come; if the report indicates an increase in purchases, it can signal future growth in industrial production.
Factory Orders:
Impact: Medium
Countries: US, Germany
Frequency: Monthly
Factory orders measures the change in the total value of new purchase orders placed with manufacturers for both durable and non-durable goods. It is meant to capture the overall health of the entire manufacturing sector, measuring new orders, inventories, total shipments and unfilled orders for the month in question. It is thus a leading indicator of industrial production (more so for Germany than US). Durable Goods (US) is a subset of Factory Orders that measures the change in the total value of new orders for long-lasting manufactured goods such as washing machines, including transportation items. It has more significance than factory orders for the US.
Industrial Production:
Impact: Medium
Countries: US, UK, Japan, Eurozone, Leading EU Countries
Frequency: Monthly
This report measures the change in the total inflation-adjusted value of output produced by manufacturers, mines, and utilities. Since it measures the change in the volume of goods produced, there is no need to worry about the distorting effects of inflation. Exports follow this report because it reacts fairly quickly to the ups and downs of the business cycle. A jump in industrial output suggests faster economic growth and can increase the demand for the country’s currency. Measured as a % change.
Business Confidence Surveys:
Impact: Medium
Countries: Australia, New Zealand, Various European Nations
Frequency: Monthly
These surveys rate the current level of business conditions in the country. Changes in business sentiment can be an early signal of future economic activity such as spending, hiring and investment. The index is based on data collected from a survey of 300+ companies.
| Difference in Forecast and Actual Changes | Currency Effect | Reason |
|---|---|---|
| Higher PMI #, Factor Orders %, Industrial Production %, and Retail Sales % than Forecast | Strengthens Currency | Higher than expected changes foreshadow growing economy (pro-currency), and central banker less inclined to lower interest rate to stimulate it. |
| Lower PMI #, Factory Orders %, Industrial Production %, and Retail Sales % than Forecast | Weakens Currency | Lower than expected changes foreshadow a slowing economy (anti-currency), and central banker may be more inclined to lower the interest rate (anti-currency) to stimulate it. |
Consumer Spending and Confidence
Consumer spending is arguably a more reliable indicator of economic health than production because spending, not production touches virtually every household. If Hewlett-Packard manufactures 1000 computers it has a limited economic impact on the main street. But if people start buying stuff, like cars, homes, computers, it has a substantial impact across the board. Consumer spending translates into sales, which translates into shipping, warehouse space, retail space, accounting, etc., all of which boosts the economy. Domestic spending tends to rise and fall in a general pattern as it is retail based, whereas production rises and falls in specific industries and depends more on international markets and the global economy. If the public isn’t spending money, nothing is going to happen.
Retail sales is another way of looking at economic activity, only from the angle of what is sold instead of produced. Retail sales are an important economic indicator because consumer spending drives large economies, particularly that of the US. Think of all of the people and companies involved in production, distribution, and selling the goods used on a daily basis. This sector influences most of the other sectors. For instance, an increase in retail sales can trigger an increase in factory production, which may then require the purchase of more raw materials and machinery (causing an increase in the PMI).
Impact on Forex and the Economy
Most developed economies now rely heavily on consumer liquidity to fuel the economy. For instance, the consumer and his spending activities accounted for 73% of reported third-quarter 2011 U.S. GDP. While the United States is the largest consumer, most major economies have spending account for more than 50% of GDP, as this table shows:
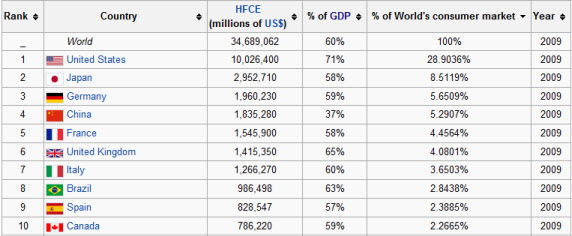
Source: Wikipedia
Consumer expenditures drive the sales, imports, factory out, business investments and job growth of the US and many other countries.
Traders like to see a healthy increase in personal income and spending as good for the currency. High consumer demand encourages more growth and puts upward pressure on interest rates, which in turn makes the currency more attractive to foreign investors, particularly if it results in a bigger return on investment than other currencies. A weaker-than-expected report on consumer spending foreshadows lower interest rates, which is bearish for the currency.
With retail sales, traders generally like to see more shopping because it spells well for the economy and firms up the country’s interest rates, which can be bullish for the currency. However, if the country is in a large trade deficit, such as the United States, an overly strong retail sales number can signal trouble for the currency because many of the retail goods are imported, and a jump in imports increases demand for non-dollar currencies to pay for these foreign products.
Economic Events
There are three stats that indicate if consumers can spend more to increase an economy:
1. Personal Income, Spending and Savings:
Impact: Medium
Countries: US
Frequency: Monthly
Personal income represents the money households receive before taxes, with wages and salaries representing 56% of all income. Because the average US household spends about 95 cents of every dollar received, these high level US consumers fuel two-thirds of their country’s economy. They buy expensive durable goods like cars, refrigerators, washing machines (12-14% of spending), non durable goods of less than three years such as food, clothing, books (30% spending), and services such as medical, haircut, legal fees, movies, air travel (60% spending). The best portent of future consumer demand can be found in real disposable personal income, which is the income left over after taxes and then adjusted for by inflation.
Retail Sales:
Impact: Medium
Countries: US, UK, Switzerland, New Zealand, Australia, Leading EU Countries
Frequency: Monthly
Consumer spending makes a large chunk of modern economies (70% in the USA), and retail sales make up a third of that. If consumers buy more, it is a sign of economic growth and prosperity. The shortcoming of the retail sales report is that it represents only spending on goods and tells us nothing about what is spent on services, which makes up the other two-thirds of consumer spending. Furthermore, retail sales are measured only in nominal dollars, making no adjustment for inflation, which makes it difficult to tell if consumers purchased additional goods or simply paid more for them. One can do the math oneself and estimate that if retail sales increased 5% in the last year and inflation as measured by consumer prices climbed 3%, then consumers actually purchased 2% more goods in the past year. The measurement of how much more, or less, did consumers buy from retailers can give us a heads up on what future GDP growth might look, as changes in real GDP correlate with changes in real retail sales.
Core Retail Sales:
Impact: High
Countries: US, Canada
Frequency: Monthly
Measures the change in the total value of sales at the retail level excluding automobiles. Since roughly 25% of total dollars spent on retail sales go towards purchases of automobiles, which is an extremely volatile category, core retail sales can smooth out the retail sales picture. Both measured as a % change.
Consumer Confidence Index:
Impact: Medium
Countries: US, Australia, New Zealand, Eurozone
Frequency: Monthly
This index examines how consumers feel about jobs, the economy and spending. If they are confident and happy, they are more likely to shop, travel, invest, but if they are doubtful and unhappy, they can tighten up on their spending and the economy may slow down as a result. Unfortunately, history has shown that the relationship between consumer confidence and spending is not as close as one might intuitively think. The strongest evidence of confidence is found at the cash register, which means in retail sales (above). However, long term the six-month moving average of consumer confidence levels has proven to be a better indicator of future household spending. Traders like to invest in currencies that have upbeat consumers, as it means a stabilizing of interest rates, increasing demand for currency, whereas depressed consumers raises the prospects of falling interest rates, which bodes ill for the currency.
| Difference in Forecast and Actual Changes | Currency Effect | Reason |
|---|---|---|
| Higher Personal Income and Spending, Retail Sales%, and Consumer Confidence than Forecast | Strengthens Currency | Higher than expected changes foreshadow growing economy (pro-currency), and central banker less inclined to lower interest rate to stimulate it. |
| Lower Personal Income and Spending, Retail Sales %,and Consumer Confidence than Forecast | Weakens Currency | Lower than expected changes foreshadow a slowing economy (anti-currency), and central banker may be more inclined to lower the interest rate (anti-currency) to stimulate it. |
Household income represents the capacity to spend, personal spending and retail sales represent a gauge on spending, and consumer confidence represents the willingness to spend. Keep in mind that consumers in the last 10 years have based much of their spending on personal credit, or borrowed money, and we have seen the fallout of this with the bursting of the credit bubble. Household income becomes more important long term forecast of future spending because it is based on what is real; only a growing consumer income can grow an economy if consumer spending represents a large chunk of it.
Growing, inflation adjusted economic activity (GDP) must be fueled by a growing, inflation adjusted consumer income. If the official GDP has been going up, and the household income has been going down, then it speaks to the fact that growing economy cannot be fueled by an equally growing consumer income and thus it is doomed to retract. For instance, in the U.S. real wages never recovered their pre-1973 recession peak and instead dropped through the decades, necessitating the number of people in an average household that had to work to make end’s meet, as well as the addition of borrowing. In the absence of income growth, debt expansion can act as a short-term prop for an economy, but in the US and Europe, it runs its full course.
Housing Starts and New and Existing Home Sales
Housing Starts and Sales relate to the construction of new homes and selling of new and existing homes, both of which can come surprisingly close to foreseeing the future direction of an economy. Residential real estate is among the first sectors to shut down when the economy nears a recession and blooms again when the economy starts back up. It outstrips the rest in being acutely sensitive to interest rates. An overheated economy and housing market drives up interest rates and mortgage prices, which eventually depresses demand for homes and discourages future construction. Conversely, when the economy weakens, home prices fall along with interest rates and home buying becomes rekindled when prices and rates become more affordable. The home building industry influences the rest of the economy through “multiplier effects”, affecting the demand for more raw materials, skilled construction workers, and purchases of home-related items such as furniture and appliances. Sales of homes, in turn, can indirectly stimulate the economy because sellers use the capital gain from the sale of one house to buy another, which invariably means additional spending on furniture and appliances, as well as greater commissions to real estate agents, moving companies and mortgage bankers. Moreover, an increase in home sales is an unmistakable sign that buyers are confident about their jobs and future income growth.
Impact on Forex and Economy
A strong housing start report can be bullish for the currency because it supports a scenario of higher corporate profits and a firming of US interest rates. More home sales indicates a stronger consumer base and a stronger currency. Conversely, a currency can fall with weak housing starts because it signals slower economic growth and thus the potential of central bankers to lower interest rates. Central bankers will lower interest rates during a sluggish housing market, causing the currency to depreciate as foreigners choose to seek out more lucrative investment opportunities outside the country.
Economic Events
Housing Starts and Building Permits:
Impact: Medium
Countries: US, Canada, Australia, Japan
Frequency: Monthly
Housing starts and permits record the number of new homes being built. A drop-off in home construction signals that the broad economy is slowing down while a rebound in housing starts and home buying signals a pickup in the economy.
Existing Home Sales:
Impact: High
Countries: US
Frequency: Monthly
This report monitors the volume of home sales nationwide, and it is a good way to gauge housing demand in the country. A drop-off, or rebound, in-home sales signals a turning point in the economy. Interest rate is the biggest force to influence home sales, with every percentage point increase in mortgage rate reducing home sales by 250,000 units.
New Home Sales:
Impact: High
Countries: US, Australia
Frequency: Monthly
Though new home sales make up only 15% of the residential real estate market, they can have a profound effect on the economy because they generate lots of investment, jobs, spending and production. Moreover, if consumer spending is about to change direction you will see it change here first, as such a big expense attracts prospective buyers who are content with their income, job security and economic outlook. When home buying wanes, banks will cut back on construction loans, investment falls away, and with it demand for building supplies, appliances and construction workers.
For traders, the rule of thumb is:
| Difference in Forecast and Actual: New Homes Built, Existing Home Sales and New Home Sales | Currency Effect | Reason |
|---|---|---|
| More New Homes Built, More Existing Homes and New Homes Sold | Strengthens Currency | A rebound in-home construction and sales signals a positive turnaround for the economy and currency. |
| Less New Homes Built, Less Existing and New Homes Sold | Weakens Currency | A drop-off in home construction and sales signals a negative turn for the economy and currency. |
Geopolitical Risks
Fancy word to describe what’s going on in the world. With currencies, it focuses on the political military / security or natural disruptions to the global economy or individual regions or nations. Global investors will shift their assets in response to geopolitical developments. Like all markets, the currency market is affected by what is going on in the world.
Natural Disasters:
Natural disasters like earthquakes, volcanoes, tsunamis, hurricanes can cause horrific devastation to a country and its economy, but the effect on the home currency is hard to predict. We know that the currency move can be dramatic, but the direction of the move is hard to gauge. Sometimes the direction defies one’s immediate best guess. For instance, when the earthquake and tsunami hit Japan on March 11, 2011, there were thoughts the Yen will bound to weaken; after all, this disaster killed over 10,000 people and leveled whole towns and threatened the entire country with major radiation from the Fukushima nuclear-plant meltdown. Moreover, prior to this event the USDJPY had fallen to 10-year lows, hovering around 83.00, despite the fact that Japan had been the grips of an 8 year recession, that its debt-to-GDP ratio was over 200% (highest level among industrialized countries) and that its finance ministers disliked having their currency be that strong. But while Japan’s Nikkei 225 Index plunged 6.18% in one day, the Yen strengthened. The USDJPY fell 350 pips new 10-year low of 79.55. One later learned that the Yen surged against other major denominations in the expectation that companies will repatriate the currency to help pay for rebuilding efforts. But this repatriation idea for currency strength cannot be so easily extended to other nations. Japan (like China) is unique in having an incredible amount of stockpiled foreign currency (particularly US dollars) as a result of decades-long positive trade surpluses, and consequently, its citizens and corporations can repatriate (sell its foreign investments and convert back to Yen) so much more than most other industrialized countries. The United States is in an opposite predicament: it has had decades-long trade deficits, and most of its citizens and corporations are living out of borrowed funds. Hurricane Katrina caused the US Dollar to lose 300 pips against the Euro in the immediate aftermath of the event on August 25, 2005, because speculators believed that the government would incur additional deficit spending to rebuild New Orleans.
Terrorist attacks:
These damage consumer and business confidence, hampering economic growth. They also increase the likelihood of war, and consequently, a budget deficit to support associated spending. The 9-11 attacks caused the dollar to lose 200 pips against the Euro in the immediate aftermath of the event, and it signaled the beginning of a 7-year bearish cycle for the dollar as the Bush government beat the drums of war.
War:
War is destructive to everything and everyone it comes in contact with, including fiat paper currencies that are used to help fuel it. Every major war in the past century has brought inflation to some degree. The big reason is that wars are massively expensive and must be paid for somehow. Wars require resources that civilians would otherwise use that need to be diverted to the war effort. Wars require deficit spending, which is inflationary in itself, but it is a deficit spending quite different from domestic deficit spending. When deficit spending is on legitimate infrastructures, such as roads and bridges, that investment will slowly “pay for itself” by boosting future productivity. However, wars are special in that vast amounts of money are spent on things meant to be blown up (or technology not later needed by civilians), so you have the double whammy of money staying at home to work its evil magic, while the goods disappear in exploding bombs that have no residual benefit. Prices and profits rise while wages and their purchasing power fall. Savings erode through the unseen mechanism of “inflation tax” – meaning that the government runs a big deficit in nominal terms but a much smaller one when inflation is factored in. It is no coincidence that US dollar declined by more than 50% against all other currencies from 2002 to 2008 when the United States was at the same time engaged in a costly and protracted war against Iraq and Afghanistan.
Elections or Change in Government Leadership:
Confidence in or wariness of a new administration can cause investors to flock to or flee from the home currency. Money is attracted to strong, effective leaders. If the new leaders are voted into office and do not have the confidence and wisdom to run a country effectively, then money will leave the country. If the new leaders want to borrow and spend more money on social programs or foreign wars than they can collect in taxes, money will leave the country. If the new leaders want to nationalize any major corporations or industries, money will leave the country. If the new leaders want to impose sharp tax increases or unnecessary regulations, money will leave the country. The rule of thumb is money is attracted to governments which are modest in ambition and friendly to business and investment.
Turmoil in other countries:
When other countries are in a state of conflict, their respective currencies may be perceived as unstable. It used to be that investors would flock to the US dollar as the safer bet. Sometimes this is still the case. However, when we saw the political turmoil in the Middle East in 2011—the revolutionary movements in Tunisia, Egypt, Libya, Yemen, Bahrain, and Syria—the US dollar suffered. History has shown that when oil-rich countries have trouble, then the US dollar falls when oil prices surge. Increasing oil prices cause inflation and dollar devaluation, and investors flee to other safe haven monetary instruments such as gold.
Financial Turmoil and the Flight to Safety:
Flight to safety means that traders move their money from one country to another in response to global financial risk. It used to be that the US dollar was the de facto currency that investors would turn to in response to increased global financial risk. Sometimes this still holds true. For instance, in the banking crisis of 2008, investors fled to the safety of the US dollar as all the markets in the world crashed. But increasingly, with the steady weakening of the US dollar and investors worried about the European sovereign debt and US debt ceiling, investors have been fleeing to gold and Swiss franc. Gold has a been see as a real monetary instrument immune to inflation as opposed to a fiat paper currency doomed to inflationary extinction. The Swiss have both a fiscal and current-account surplus, a low inflation rate and relatively low debt-to-GDP ratio, and consequently, investors flee to the safety of the Swiss franc when the Swiss Central Bank does not overly manipulate it.
 Копирайте линк
 Споделете във Facebook
 Споделете в X
 Споделете по имейл