Forex Strength Meter | Currency Heat Map
 John Lee Rossi
Updated 07 October 2022
John Lee Rossi
Updated 07 October 2022
A Forex strength meter is a visual tool (also in the form of an indicator available for several trading platforms) to help finding which currencies are currently trading strong, and which ones have weak trading levels.
- Forex strength meters are useful to identify which currency pairs are trending strongly
- Currency heat maps are another tool similar to strength meters used to visually identify strong currency pairs correlations
- When finding a currency pair in a strong bullish or bearish trend it is advisable to confirm it with a trend indicator or oscillator
Table of Contents
Forex Strength Meter and Currency Heat Map
Forex strength meters use the currencies exchange rates of different pairs to originate a comparable strength for each currency. The overall result of the currency strength for the Euro will be extracted from the recent values of this base currency against a pool of several other currencies.
For example, to measure the strength of the Euro currency, the strength meter would calculate the exchange rate strength of all pairs with EUR; EUR/USD, EUR/JPY, EUR/CAD, EUR/AUD, etc.
Forex and Currency Heat Map
Just like a Forex strength meter, a currency heat map, works about the same way. The currency heat map displays a quick overview of the FX market price action.
Looking at the heat map, traders can spot which currencies are stronger, and weaker in real-time, and how strong they are in relation to one another.
How can This Tool Help You on Your Trading?
These visual tools can be used as a quick guide to which currencies pairs you might want to trade, and which might be worth discard. For example, if a certain currency is very strong, and suddenly another turns weaker, you may find a trading opportunity for that currency pair.
Deviation between currency pairs normally indicates trend momentum. The same way, if two currencies are strong, weak or with just average strength, it can be often interpreted as a range trading, and therefore you might want to stay away from those currency pairs.
The currency heat map tool can help traders with their trading strategies by showing which currency pairs might have better trading opportunities and help you to trade with confidence.
Visually, the heat map shows which pairs are trending up, with a dark green percentage (the higher the percentage, the stronger the trend), and the dark red percentage means that a currency pair is in a downtrend.
How to Use Currency Correlations to Calculate Currency Strength?
In Forex, currencies are traded in pairs, for example, the GBP/USD is the British Sterling traded against the US dollar, and therefore currency correlations can be used to measure the strength of individual currencies.
A positive correlation can be found when two pairs move in the same direction, the same way, a negative correlation is present when two pairs move in opposite directions. Also, a no currency correlation can occur if the pairs move randomly with no detectable relationship.
The currency correlation coefficient can range from -100 to 100, or -1 to 1 and represents how strong, or weak, a correlation is between two Forex pairs.
The following table shows the correlation coefficient between some of the most popular currency pairs. You can compare each currency pair to see how they are correlated to one another. For example, on the table below you can see that the correlation between the EUR/USD pair and the GBP/USD pair is 77, meaning that the likelihood of these two pairs moving in the same direction is quite high.
Opposite, you can see that the correlation between the EUR/USD pair and the USD/CHF pair is -77, meaning that the likelihood of these two pairs moving in the opposite directions is quite high.
| EUR/USD | GBP/USD | AUD/USD | EUR/GBP | USD/CAD | USD/JPY | USD/CHF | |
| EUR/USD | 77 | 75 | -43 | -79 | -46 | -77 | |
| GBP/USD | 77 | 70 | -90 | -85 | -56 | -57 | |
| AUD/USD | 75 | 70 | -49 | -68 | -41 | -36 | |
| EUR/GBP | -43 | -90 | -49 | 68 | 49 | 30 | |
| USD/CAD | -79 | -85 | -68 | 68 | 45 | 70 | |
| USD/JPY | -46 | -56 | -41 | 49 | 45 | 57 | |
| USD/CHF | -77 | -57 | -36 | 30 | 70 | 57 |
For example, if the GBP/USD and the EUR/GBP pairs have a correlation coefficient of -90, this means that these two pairs have a strong negative correlation, and these two pairs are likely to move in opposite directions.
Opening two long, or two short trades, simultaneously in these two pairs it is therefore not recommended. If in the first pair, the GBP is the base currency, meaning that long trades expect the GBP to strengthen against the USD, in the second pair, the GBP is the quote currency, meaning that short trades expect the GBP to weaken versus the EUR.
Thus, a GBP/USD long trade means one is expecting the GBP to strengthen, while a EUR/GBP long trade means one is expecting the GBP to weaken.
Regarding currency strength, because there is such a high negative correlation between the two pairs, it is correct to assume that the GBP, the common currency between the pairs, is the one behind the price action, and therefore, the GBP is the strongest currency in this example.
On the other hand, because these two pairs have such a high negative correlation, two simultaneous trades, long on GBP/USD and short on EUR/GBP, will likely result in winning or losing both trades.
Using Trend Indicators to Confirm a Currency Pair Strength
So, after finding a currency pair with the Forex strength meter, and before opening a long or a short trade, it’s good practise to confirm the actual trend. For that bit of technical analysis, a trend indicator like the ADX (Average Directional Index) can be used.
The ADX was developed by J. Welles Wilder in order to gauge the strength of the trend, whether in a bullish or bearish phase. The ADX is a trend indicator plotting values that varies from 0 to 100, but values above 50 are a rarity. An ADX value below 15 indicates a weak trend, while values above 30 indicate a strong trend.
This trend indicator is not used to indicate whether the trend is up or down, but simply to measure its strength. In turn the ADX indicator is used for a very important purpose, to identify if the market is in a trading range or trending.
Theoretically, an ADX value between 10 and 15 identifies a flat market, values between 16 and 25 are interpreted as a ranging market and valued between 26 and 40 indicate a strong trending market. Values greater than 40 can be used to identify an excess (overbought or oversold) phase.
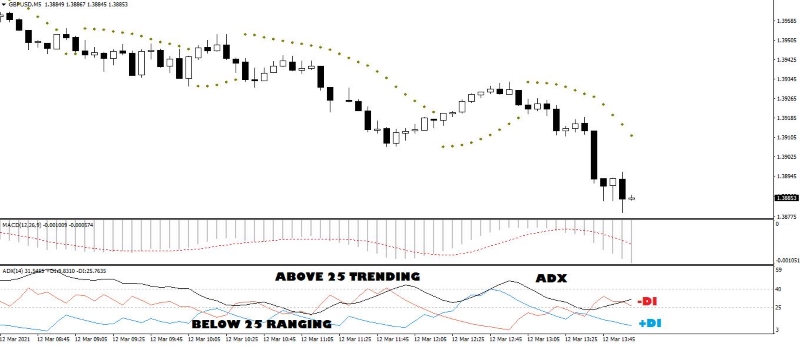
As you can see on the image above, the black line is the ADX value indicating the current trend strength, while the other two lines, the red and the blue, are the two complementary indicators that make up the ADX, the -DI and +DI respectively.
The ADX indicator is derived from two indicators: Positive Directional Indicator (+DI) and Negative Directional Indicator (-DI).
The +DI measures the strength of the upward movement, while the -DI measures the strength of the downward movement, over a given period. Generally, a period of 14 bars is used, but can be modified and adapted according to market needs.
The ADX signals are generated by the crosses of the indicators +DI and -DI, precisely when the +DI is above the -DI, it indicates that a bullish trend is in progress, and when the -DI is above the +DI it indicates that a bearish trend is in progress.
Trend Strength Momentum
Since trends are composed of a series of price movements, momentum plays a key role in understanding the actual trend strength. Therefore, it is very important to know when a trend strengthens and also when it’s slowing down.
Careful though. A trend with less strength does not always lead to a reversal, but simply it might signal that the current trend may be consolidating or, yes, changing and reversing.
Trend strength momentum refers to both the direction and the strength of the price. Comparing price movements helps the trader to gain insight into the price momentum.
Definition of Price Momentum
The magnitude of price momentum is measured by the length of the short-term price movements. The beginning and the end of each swing is determined by pivot points, which form positive and negative swings.
Strong momentum occurs when a steep slope is required over a long price swing. Weak momentum, on the other hand, occurs if the slope is gentle and the swing rather short.
For example, the length of a positive swing can tell us a lot about momentum. A longer positive swing, than the previous one, suggests that the trend is increasing its strength, i.e., its momentum is strengthening.
A shorter positive swing, on the other hand, suggests a weakening of momentum and thus of the strength of the trend.
Price oscillations of an asset are not so simple to estimate with the naked eye. There are several technical momentum indicators, and oscillators, that can be used in order to understand the price action and to have a clearer vision.
In practice, they allow traders to compare swings on indicators data rather than comparing swings on lines in a chart, allowing for a more objective view of momentum.
Momentum Indicators
The most common momentum indicators for measuring price movements are the RSI (Relative Strength Index) and the Stochs (Stochastic Oscillator).
To find out more about these two precise and extremely common, and how to use them in your trading strategy, we suggest a quick visit to our article What is Relative Strength Index and How to Use Stochastics in Forex Trading. Let's see a practical example on how to use the combo of all the indicators.
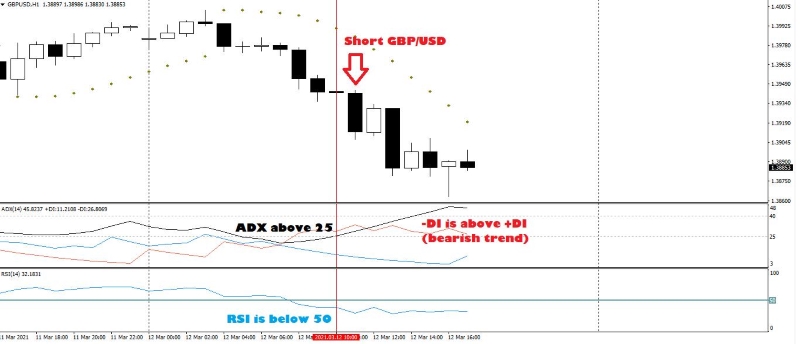
On the 12th of March 2021, the GBP/USD pair was identified on the currency heat map as bearish. On the above image we can see a bearish trend forming two bars previously the red line, when the -DI (red line) crossed the +DI (blue line).
Still, the ADX was at 21, below the recommended 25 level, that signals a trend is in place. Two bars later, marked with the vertical red line, all the conditions are met.
The -DI is still above the +DI (bearish trend), the ADX level is at 26 and we quickly check the RSI (at 38) to confirm that a downtrend is in place, and that we are not entering a short trade on an oversold zone, that could be exhausting and a bears trap.
That said, this short trade produced a rewarding outcome of +60 pips, closed at the 5th after the red line, when ADX went over the 40 level, signaling a possible excess phase.
Conclusion
Forex strength meters and heat maps can be of great aid to quickly identify which currencies have better chances of catching the attention of traders. They are also useful to see which currencies are weak, or in a consolidation range, and that traders should avoid.
As your probably heard countless times, “the trend is your friend”. So, if a currency in identified with the strength meter, or via the heat map, that is currently and strongly going up versus other currency, and you are tempted to place a short because it’s time that it retraces a bit, think twice.
Instead, use those tools to identify which currency is stronger (for a long trade) or weaker (for a short trade) versus its peers, apply a couple of indicators or oscillators to your charts, and wait for an entry signal. Chances are, that if you’re trading with the trend, and timing your entry accordingly, the outcome could be some nice green pips.
If you would like to discuss the contents of this article, or make any suggestions, or even reveal your top-secret strategy, please use the comments box below.
John Lee Rossi, currently head of fundamental and technical research with Clear Markets Ltd., is a seasoned trader with more than 16 years experience trading in the financial markets. John previously worked for several brokerage companies, operating in different OTC markets, specialising in a wide range of financial products, from Forex trading to commodities trading. Happily married to his lovely wife Frances, John has two teenage daughters. Away from the business, he enjoys hiking, golfing, and spending time at the Ozarks lake with family and friends.
 Копирайте линк
 Споделете във Facebook
 Споделете в X
 Споделете по имейл