What are Bollinger Bands in Forex
Bollinger Bands are one of the most popular technical indicators in any financial market, including Forex. They were created by John Bollinger in the early 1980s from the need for adaptive trading bands that could accurately reflect price volatility. Learn in this complete article what is Bollinger Bands in Forex, an indicator used by professional traders and how to read it's signals.
Table of Contents
They are most often used to determine overbought and oversold levels, selling when price touches the upper Bollinger Band and buying when it bounces off the lower Bollinger Band. This technique works well in range-bound markets, and for getting in on bounce trade in the direction of the main trend. One can also use Bollinger Bands to enter in breakouts beyond the bands, particularly after a period of time in which the bands have been relatively narrow. We will examine in due course both these methods: the bounce and the break.
Bollinger Bands in Brief
Bollinger Bands consist of a set of three bands drawn in relation to price: there is the 20-period moving average in the middle, with an upper and lower band of two standard deviations above and below the simple moving average. Standard deviation is a statistical measure that offers a good reflection of price volatility. Since 68% of the data falls within plus or minus one standard deviation of the average, then a standard deviation two means that price will be distributed 95.5% within the two deviations of the mean. These trading bands plotted in and around the price structure form an “envelope” and it is the action of prices near the edges of the envelope that are of particular interest.
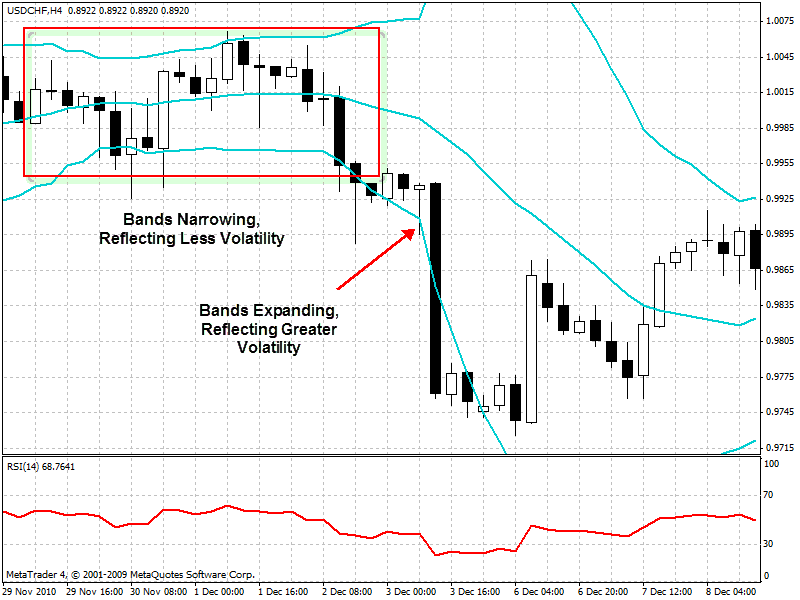
When the price sharply changes, the bands will widen and expand, reflecting greater volatility, and when prices do not change much, the bands will narrow and contract, reflecting the lack of volatility.
We do not need to go into the mathematical formula behind Bollinger Bands, or its history, because for all practical purposes that information is irrelevant. If you really want to know about the calculations and minutia behind Bollinger Bands you can visit www.bollingerbands.com.
Bollinger Bands Strategy #1: Bollinger Bounce
Studies have shown that the penetration of Bollinger Bands only occurs up to 15% of the time. The rest of the time prices fluctuate within the Bollinger Bands, and often price returns to the middle of the bands. In this way Bollinger Bands seem to act like rubber bands that can only stretch so far before snapping back to the middle or mean. The upper and lower ranges of the Bollinger Bands, which are created by the 2-standard deviation lines, create the boundaries of price.
Since there are greater odds that price will be contained within the bands instead of penetrating them, one of the surest and most common ways of trading the Bands is to buy when prices near the lower band and sell when prices near the upper range band.
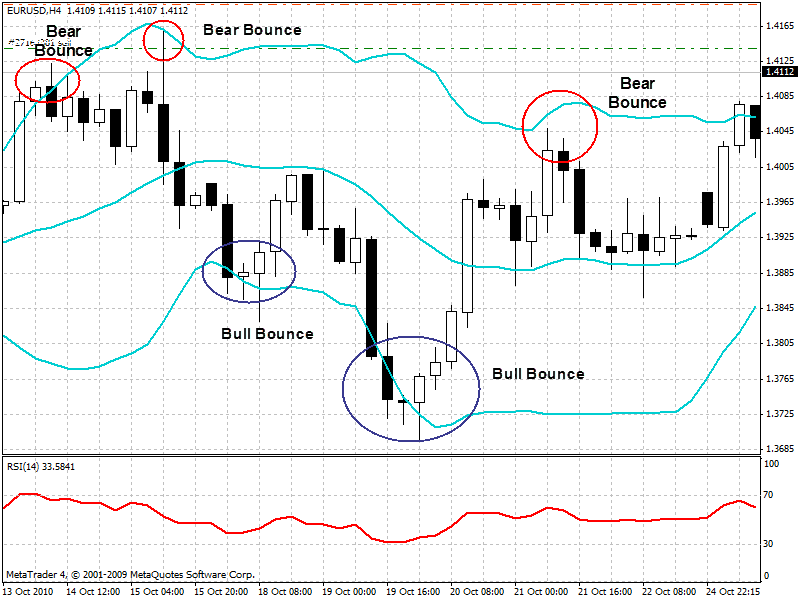
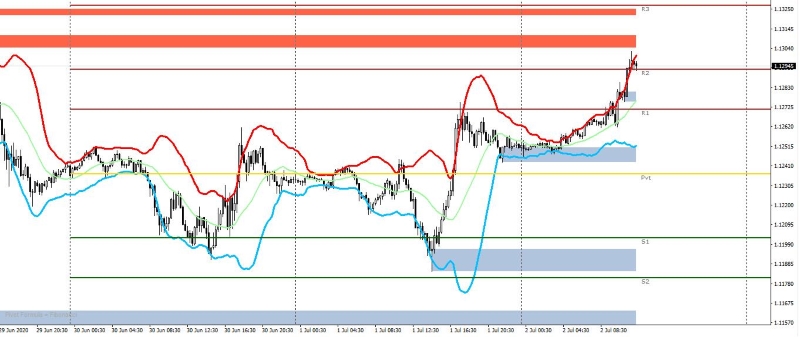
You can see in the above chart that there are at least 5 instances in which price touched the outer bands only to retrace back to the middle or to the opposite band. This does not mean that one should take counter bounce trades at every time price meets the outer bands. It is much smarter to take counter bounce trades in the direction of the main trend, along with additional confirmation indicators such as candlesticks and RSI.
Bollinger Bounce Confirmation Indicators: RSI and Candlesticks
Just because prices hit the upper or lower Bollinger does not necessarily mean that it is a good time to sell or buy. Strong trends will “ride” these bands and wipe out any trader attempting to buy on the “low” prices in a downtrend or sell on the “high” prices of an uptrend. In fact, price will be making new highs in an uptrend and new lows in a downtrend, hitting and exceeding the bands, quickly taking out the stops on trades taken directly on the bands. It is thus a good idea to trade the bounce with other confirmation indicators like the RSI and Candlesticks.
If you are trying to trade the bounce from Bollinger, it is often good to see pay attention to the Relative Strength Indicator or RSI. We are not looking to the RSI to see if it is overbought or oversold, but to see how it is strengthening or weakening. In general, one would short the currency if penetration of the upper Bollinger Band occurs while the RSI is showing weakness (greater than 50-80 and falling). Conversely, one would buy the currency if penetration of the lower Bollinger Band occurs while the RSI is showing strength (below 30-50 and rising). In this fashion, we are looking at RSI as an early trend indicator, confirming the counter-trend move off the bands.
Also, one can be patient and wait for the candlestick that confirms the reversal. Once the bar penetrates the upper band, you can look for bearish candlesticks, and once the bar penetrates the lower band, you can look for bullish candlesticks. If the candlesticks are making new highs or lows beyond the bands, that is not a good time to enter. But if a candlestick after the penetration fails to make a new high or low, watch to see if then forms a bearish or bullish formation: long black body or long upper shadow for Bearish, and long white body or long lower shadow for Bullish. Please refer to my article on Candlestick Patterns.
Optimal Bollinger Bounce Time Frames: The longer the time frame, the more infrequent the bounce opportunities yet stronger the bands tend to be. It is a trade-off. You want to have many opportunities and you want to have strong bands, but it is hard to find the balance in both. We have found H4 to work the best. You will get plenty of trading opportunities and the timeframe reflects strong bands.
Bullish Bounce:
A bullish bounce (or bullish reversion) is when the currency is in an uptrend and then pulls back to the lower Bollinger Band. Your entry should be a bullish candlestick that has already reversed into the pre-existing trend.
Entry Conditions:
- Currency is in an uptrend
- Currency hits or comes very close to hitting the lower Bollinger
- Look for RSI to be below 30-50 and rising
- Look for Bullish reversal candlesticks and patterns
* Make sure you take only 1-2 such trades per day. If you have been stopped out on two trades, it is a sign that the market is in a strong corrective phase, and taking further bounce trades off the bands is not a good idea.
Exit Conditions:
- Stop loss that is 20 pips below the 3rd deviation lower band (you need to plot one), or 50-80 pips from entry.
- Breakeven trigger at the middle of the bands.
- Take profit at the other Bollinger Band or 100-150 pips.
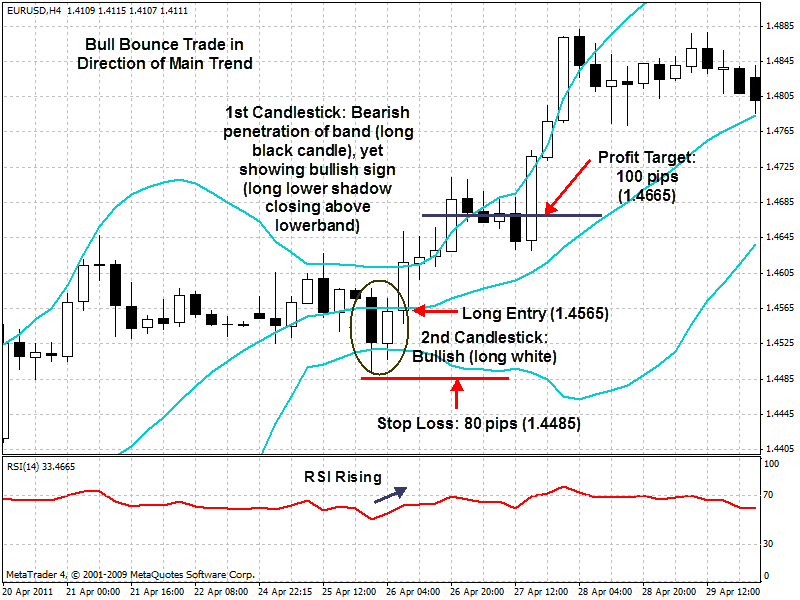
In the above chart the bands had narrowed just after an expansionary phase, indicating the time was ripe to take advantage of a bull bounce trade in the direction of the bullish main trend. The bullish candlestick that penetrated the lower band retreated to close just above, indicating that this was the time to get ready to pull the trigger. Since the next candlestick showed a nice bullish body, and RSI had strengthened, it was time to enter long at the close of that bar (1.4565). Four candlesticks later my 100 pip Take Profit was hit. Using these multiple conditions for confirmation ensures a more probable win.
Bearish Bounce
A bearish bounce (or bearish reversion) is when the currency is in a downtrend and then pulls up to upper Bollinger Band. Your entry should be a bearish candlestick that has already reversed into the pre-existing trend.
Entry Conditions:
- Currency is in a downtrend
- Currency hits or comes very close to hitting the upper Bollinger
- Look for RSI to be above 50-80 and falling
- Look for Bearish reversal candlesticks and patterns.
* Make sure you take only 1-2 such trades per day. If you have been stopped out on two trades, it is a sign that the market is in a strong corrective phase, and taking further bounce trades off the bands is not a good idea.
Exit Conditions:
- Stop loss that is 20 pips above the 3rd deviation upper band (you need to plot one), or 50-80 pips from entry.
- Breakeven trigger in the middle of the bands.
- Take profit at the other Bollinger Band, or 100-150 pips from entry.
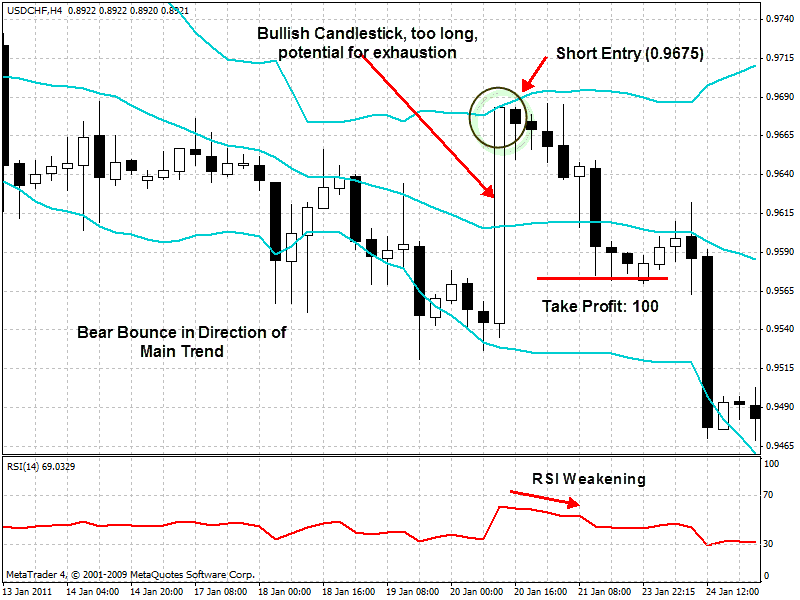
In the above chart market had been slowly creeping lower, indicating that the larger trend had been down, when unexpectedly a very long Bullish candlestick forms from the lower band and ends at the upper band. These types of candlesticks on steroids are rare, probably triggered by a news event, and when they occur counter to the main trend, you can bet that they will have exhausted themselves by the time they have bridged the entire Bollinger Band corridor. Seeing that candlestick form and then touch the upper band would have been an alert to load your gun and take aim at the head of this intruder. Seeing that the next candlestick fails to make a new high and becomes bearish, in addition to seeing the RSI weakening, are the signals to pull the trigger. Price never does continue forward but falls from the entry, and over the course of the next few candlesticks, the 100 pip take profit is easily achieved.
Benefits and Risks
This bounce setup is dynamic, meaning that it works on all time frames. Short-term traders can use it on the hourly charts, intermediate-term traders on the four-hour charts, and position traders on the daily and weekly charts. Bear in mind that the shorter the timeframe the less reliable the signal, though we still want a timeframe that can give us some trading opportunities.
Many traders have developed enormously successfully Bollinger Bounce systems that can take advantage of ranging conditions, or better yet, a correction from the trend. Now, what happens when the market trends beyond the Bollinger Bands? Hopefully, your bounce strategy’s filters would have prevented you from getting into that trade, or else you would have been stopped out. You can also exploit the breakout opportunity, as we see below.
Bollinger Bands Strategy #2: Bollinger Break
The breakout from Bollinger can often be anticipated by what is called the squeezing of the bands. When the bands squeeze together, or narrow, the market has entered into a channeling phase of low volatility. The longer it moves within this narrow band, the more likely the market is eventually going to penetrate these bands and continue on in the direction of the breakout, especially if this event occurs in the direction of the previously established longer-term trend. Timing is everything, however, and just we do not know how long the squeeze will last.
Note: Bollinger Band as Filter. You definitely do not want to be in a breakout trade during a range bound market. If you tried to breakout at the top of range bound channel, it will become the noose that hangs you as the market falls back to the other side of the channel. One way to determine if the market is range bound is to apply the Bollinger band as a filter. What you do is measure the distance between the upper and lower band. You determine through back-testing that if the distance is less than X pips (we will call it BBRange) then the Bollinger bands are too narrow and you should avoid trading. If the market had been in this narrow BB range and then expands beyond it, then that becomes the second and third condition of the entry setup. The first condition is that you should be only taking trades in the direction of the main trend.
The hooking of the bands: the upper band pointing up and lower band pointing down. The visual key is to watch both the upper and lower band as price approaches them. If the bands remain flat or constrict or just one band hooks while the other does not, then you have a sign that not much is about to happen yet. However, if upper band is rising while the lower band is falling, this signifies that a potential explosion in price action is about to occur, in the direction of the candlestick pushing against the band. The more vertical, the stronger the potential move.
Other indicators: Candlestick and RSI. Just like the bounce trade, you can use the candlestick patterns and RSI as confirmation indicators for taking the trade. You want a breakout or breakdown candle to have a bit more range than otherwise. You want RSI to be strengthening for a Bullish trade and weakening for a bearish trade.
Bullish Break
A bullish break occurs after constriction of the Bollinger Bands and then price breaks and expands the upper band to the upside. The upper band is pointing up and the lower band is pointing down.
Entry Conditions:
- Currency is in an Uptrend
- Currency was locked in a narrow band
- Price reaches upper band and upper band hooks up while lower band hooks down
- Breakout candle has more range than previous candles
- RSI is 30-50 and rising
Exit Conditions:
- Stop loss that is 20 pips below the middle band, or 50-80 pips from entry.
- Take profit that is 100-150 pips from entry.
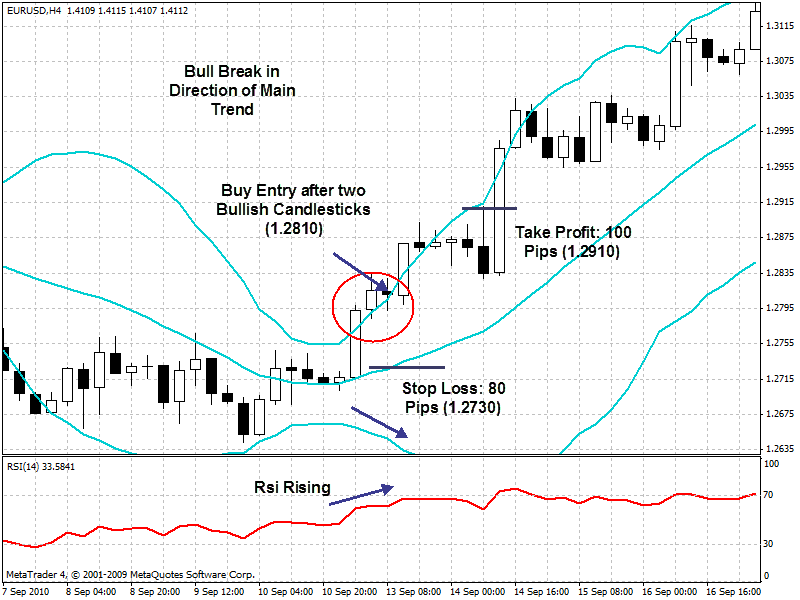
In the chart above the market had entered a brief contraction (squeeze) period of 5 bars, which would have alerted the trader to be mindful of a potential break beyond the upper band in the direction of the main trend. When a strong and healthy bullish bar moves up from the middle band to penetrate the top band, that would be the sign to pay attention: a break has just happened and we want a couple confirmation signs. One confirmation sign is that visual cue that the upper band is hooking upwards at the same time that the lower band is hooking downwards. The other confirmation sign is that the next bar is also bullish and makes a new high, indicating that the break had been successful, and with no bounce in sight, one should enter a buy at market at the close of the candlestick.
Bearish Break
A bearish break occurs after constriction of the Bollinger Bands and then price breaks and expands the lower band to the downside. The upper band is pointing up and the lower band is pointing down.
Entry Conditions:
- Currency is in a Downtrend
- Currency was locked in a narrow band
- Price reaches upper band and upper band hooks up while lower band hooks down
- Breakdown candle has more range than previous candles
- RSI is 50-80 and falling
Exit Conditions:
- Stop loss that is 20 pips above the middle band, or 50-80 pips from entry.
- Take profit that is 100-150 pips from entry.
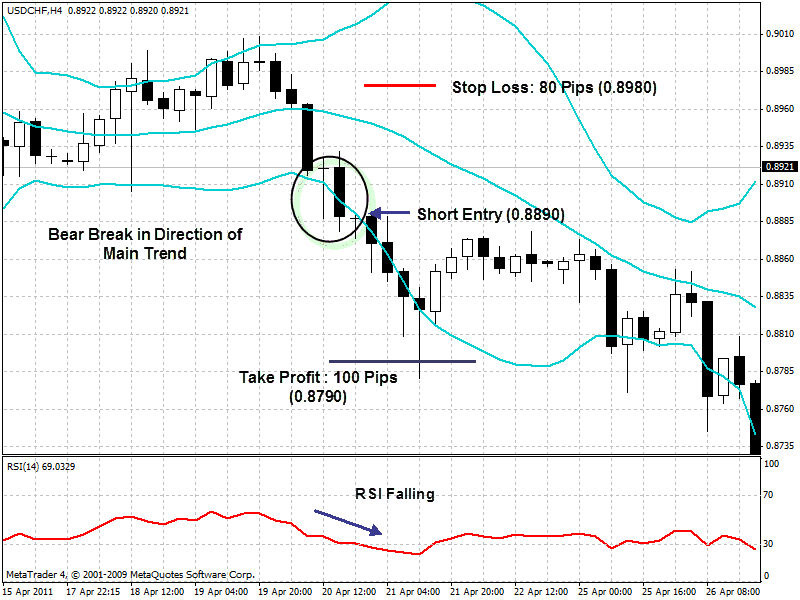
The above chart starts with the market narrowing, with the candlesticks trying desperately without luck to push the market and upper band higher against the downward current of the main trend. When three strong bearish candlesticks then descend down to the lower band, one would have awakened like Goldilocks to the potential southern break. The fourth candlestick that penetrates the lower band becomes a long-legged Doji, it would have given pause as to the determination of the bears. However, one would be given confidence by the visual cue that the upper band was hooking up at the same time that the lower band was hooking down. Moreover, one would have seen that the RSI was weakening. When the fifth candlestick becomes strongly bearish, you would had a more definite confirmation that the break had been successful and you would have put a sell at the close of the candlestick, easily capturing 100 pips over the next four candlesticks.
Benefits and Risks
Though the breakout squeeze trade occurs less frequently than the bounce trade, it is still a very powerful strategy to consider using. It may occur only 15% of the time, but when it occurs it can represent a very significant breakout move.
Bear in mind that if you try to take on every breakout instance where the price pushes against the bands, your account would be quickly destroyed. You have to be on the watch for other confirmation indicators. You should be trading in the direction of the main trend after the bands had already narrowed for a period of time. You want the bands to hook vertically up and down, you want the penetration candles to be large, and you want RSI to be strengthening for Bullish trades, weakening for Bearish ones. If you follow all these conditions you can still be wrong, and thus you must place a fixed stop not too far away from entry, hiding out behind the middle band.
 Link másolása
 Megosztás a Facebookon
 Megosztás az X-en
 Megosztás e-mailben