How to Use Stochastics in Forex Trading
Stochastics measures the momentum of price. If you visualize a rocket going up in the air — before it can turn down, it must slow down. Momentum always changes direction before price.
Stochastics are among the most popular technical indicators when it comes to Forex Trading. Popularity is difficult to quantify, but according to a quick review into the free indicator/EA repository of desynced.net/fx/eas/, it is the fourth most popular indicator used as a basis for EA construction:
| Popularity Rank | Indicator | EAs Based Upon | Indicators Based Upon |
|---|---|---|---|
| 1 | Moving Average | 886 | 2353 |
| 2 | MACD Histogram | 273 | 255 |
| 3 | RSI | 257 | 547 |
| 4 | Stochastics | 196 | 331 |
| 5 | CCI | 138 | 333 |
| 6 | Parabolic | 129 | 140 |
| 7 | Bollinger Bands | 67 | 146 |
| 8 | Larry Williams Percent Range | 62 | 183 |
| 9 | Movement Directional Index | 59 | 240 |
| 10 | Momentum Indicator | 45 | 68 |
The late George Lane, a professional trader for 50+ years and widely respected technical analysis educator, developed this indicator in the late 1950s in order to measure the current close relative to the range (high/low) over a set of periods.
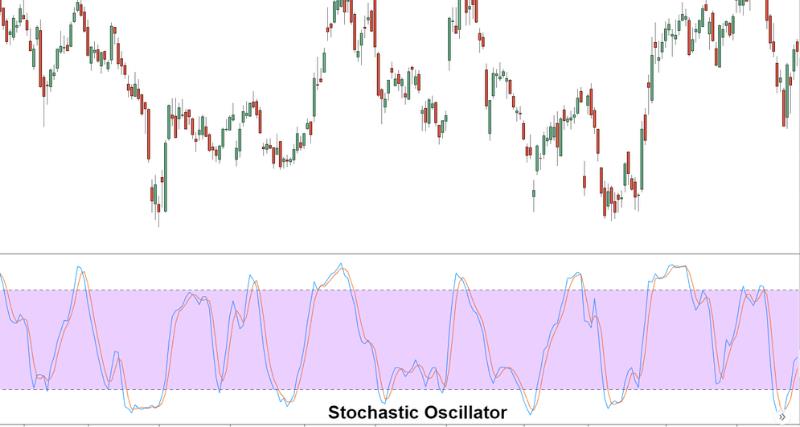
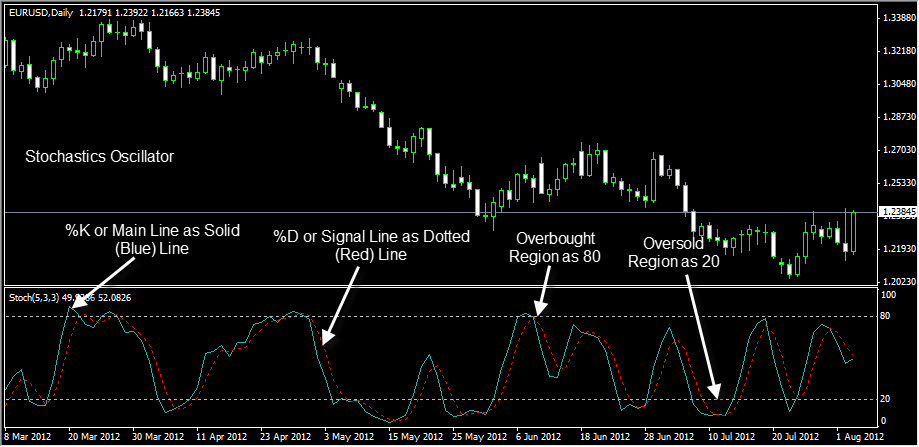
Stochastic is a momentum oscillator, which consists of two lines:
- %K (or Main Line) = this is the main Stochastics line and it displayed as a solid line
- %D (or signal Line) = this is simply a moving average of the %K, it is sometimes called the signal line, and is displayed as a dotted line.
The trigger levels are added to the chart at 20 and 80. When the Stochastic lines are above 80, the market is considered overbought, and when below 20, oversold.
Traders have adopted stochastics to measure trend direction, trend strength, and trend change. Here are the levels and their importance:
| Stochastics Level | Trading Action |
|---|---|
| between 30-50 and rising | Bullish |
| 80-100 | Extremely Bullish and Overbought |
| Previously above 80, now below | Short Signal |
| between 70-50 and falling | Bearish |
| 0-20 | Extremely Bearish and Oversold |
| Previously below 30, now above | Long Signal |
We are most concerned about the two signal methods:
- Method #1: Stochastic Line Crossing Signal Line
- Method #2: Stochastics Crossing Overbought/Oversold Zones
Each method is simple to learn and use.
Method 1: Stochastic Crossover of Signal Line
Basically, this is the crossover of the faster moving main Stochastic line (%K) over or under the slower moving Signal Line (%D). This crossover looks similar to moving average crossover, wherein the trade signal is derived from the fast line crossing the slow line.
| Entry Signals | Conditions |
|---|---|
| Buy Signal | Stochastics Line (%K) crosses above Signal Line (%D) |
| Short Signal | Stochastics Line (%K) crosses under Signal Line (%D) |
Exit Rules:
Could be fixed stop-loss determined by back-testing, or simply an exit via the opposite trade signal:
| Exit Signals | Conditions |
|---|---|
| ExitBuy | When Stochastics Line (%K) crosses above Signal Line (%D). |
| ExitSell | When Stochastics Line (%K) crosses below Signal Line (%D). |
Example of Bullish Crossover on EURUSD Daily Chart:
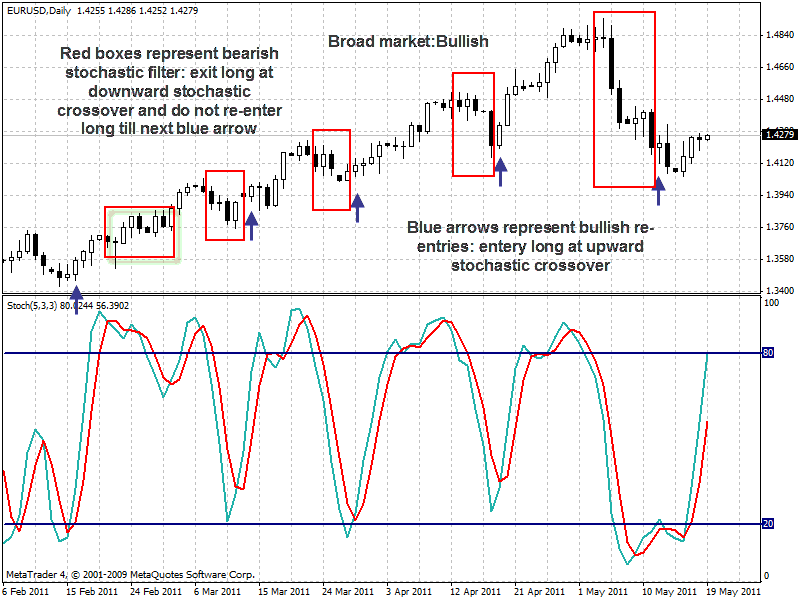
From February to May 2011, the EURUSD was in a strong bullish uptrend, and if one would have played the crossover method, it would have been smart to only trade the long side of the crossover (indicated by the blue arrows), and exiting and staying out of the market at the short side of the crossover (indicated by the red boxes). There would have been 5-6 fantastic buy signals to position one into the market at a fair market price, just after the market had been in a brief bearish phase. Once you know the overall trend of the market, you can play the side of the trend to great effect using stochastic crossover method.
Example of Bearish Crossover Method on USD/CHF Daily Chart:
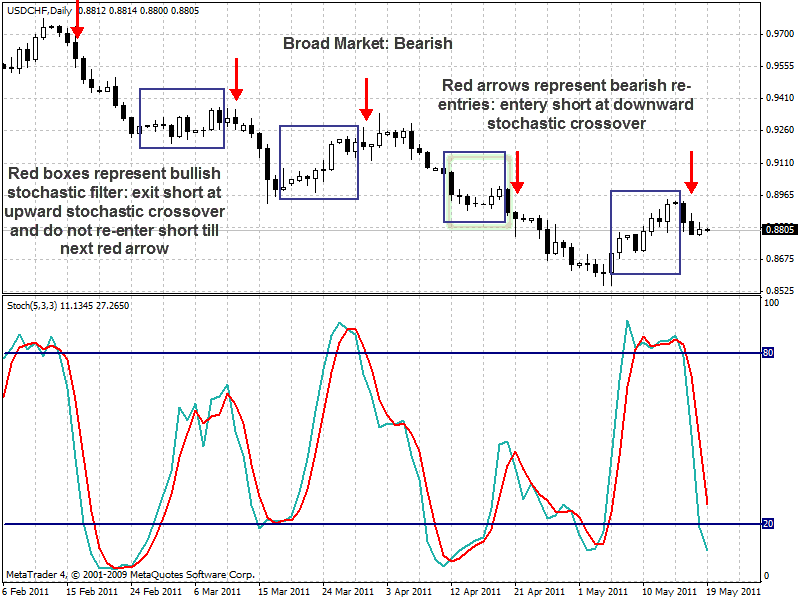
From February to May 2011, the USD/CHF was in a strong bearish downtrend, and if one would have played the crossover method, it would have been smart to only trade the short side of the crossover (indicated by the blue arrows), and exiting and staying out of the market at the long side of the crossover (indicated by the red boxes). There would have been 5 decent sell signals to take advantage of different downward moves on overall downtrend market, and the buy signals (taken only as exits) would have had you exit each of these short trades with nice profit, at the same time helping you avoid some bullish corrective phases that would have ate into your profits.
As we can see from the above illustrations, adding two filters to stochastics signal crossovers enhances performance:
- Overbought/Oversold Filter: Crossovers that happen above 80% level for short trades, and below 20% level for long trades are treated as stronger signals compared to crossovers outside these levels. However, using this filter greatly reduces the number of trades.
- Trending Market Filter: when the market is trending, then signals with a higher probability of success are those in the direction of the trend. When the market is trending up, one should only look for oversold conditions to enter a buy trade, and when the market is trending down, one should only look for overbought condition to enter a sell trade. If the market is ranging, or trend-less, you may buy and sell as indicated above, without having to trade in the direction of the trend.
Stochastics Parameters and Time frames:
There are a number of different parameters and time frames that will work for any pair. Some traders have made effective use of a larger parameter set (21,9,9), while others have shown more promise with the smaller parameter set that is the initial default in MT4 (5,3,3). Some prefer to trade with the daily chart and others with the H1 chart. The choice involves a balance between sensitivity and reliability. Generally, the smaller the stochastic parameters or time frame, the faster it will react to market changes, and the more crossovers will be shown. The downside is that these crossovers can be less reliable. In contrast, the larger the stochastic parameters or larger the time frame, the slower is the reaction time, with the downside being less trading opportunities and upside being more reliable trading signals. Every trader should back-test their stochastic system using different parameters values and different time frames to see which sets and times perform the best.
Method 2: Stochastics Trading the Overbought / Oversold Zones
Stochastics at 80% level is considered overbought and at 20% level considered oversold. While it is tempting to buy in the oversold and sell in the overbought zones, it must be remembered that these zones can also represent a strong continuation of the current trend. Thus, traders should only enter counter-trend trades when Stochastics leaves these zones.
| Entry Signals | Conditions |
|---|---|
| Buy Signal | Stochastics crosses over oversold level (20) from below. |
| Short Signal | Stochastics crosses under overbought level (80) from above |
Exit Rules:
Could be fixed stop loss and take profit determined by back-testing, or simply an exit via the opposite trade signal:
| Exit Signals | Conditions |
|---|---|
| ExitBuy | Stochastics crosses under overbought level (80) from above |
| ExitSell | Stochastics crosses over oversold level (20) from below |
The bane of this counter-trend strategy is that the market continues to trend, and thus there are a couple of filters that need to be implemented:
- Trending Market Filter: Do not buy or sell when stochastics falls below or above the zones but only when they emerge from the zones. You are to wait for the stochastic lines to enter into the overbought/oversold zones and then come out of it. When the price is trending, Stochastic lines may easily remain in the overbought/oversold zone for a long period of time. To take trades only when the lines are within the zones would be dangerous.
- Trending or non-Trending: If the market is trending, it is a good idea to only trade in the direction of the trend. To take counter-trend trades against the main trend would be dangerous to your account. If the market is ranging, then it can be profitable to take counter-trend trades on both sides of the market. However, determining the timing of when a market begins and ends a trending period, and when it begins and ends a range period, can be difficult. Some currency pairs, such as EUR/CHF and EUR/GBP, exhibit more range-bound behavior than others, and thus they may be more suitable for exploiting both sides of the overbought and oversold zone.
Example of Stochastics Overbought/Oversold Trading on EURCHF Daily Chart:
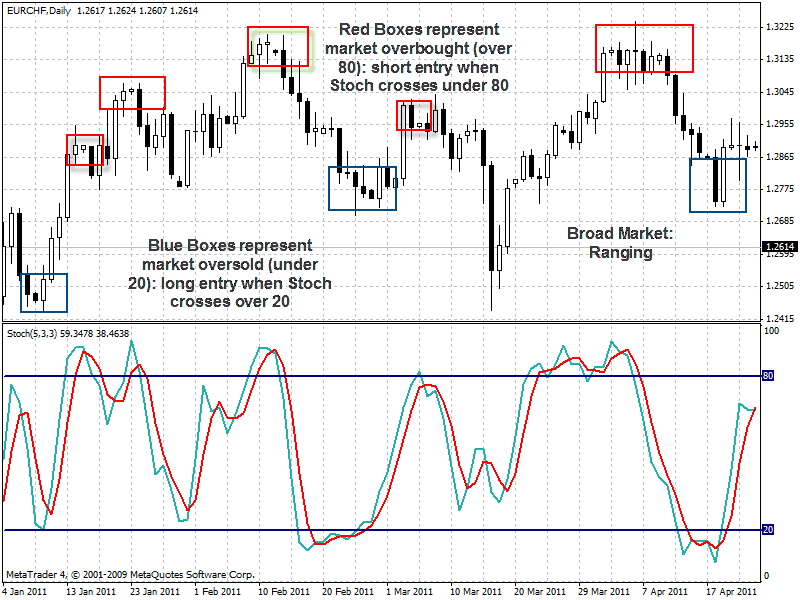
Since the EUR/CHF is generally a range-bound pair, it is a good one to illustrate how one could have bought and sold whenever Stochastics entered and left the overbought/oversold zones. Between Jan to May on the EUR/CHF daily chart, there have been three times wherein stochastics had entered into the oversold zone of 20 and then left it, resulting in buy signals. It was the first buy signal (a brief touch of 20) in January that would have won hundreds of pips, and Stochastics traders could have easily missed this if they were first expecting the line to fall under 20. The short plays were more frequent and powerful. There were five nice short signals initiated when the stochastics entered the overbought zone and left it, and one could have made hundreds of pips on each of them.
Example of Stochastics Overbought/Oversold Trading on GBP/USD Daily Chart:
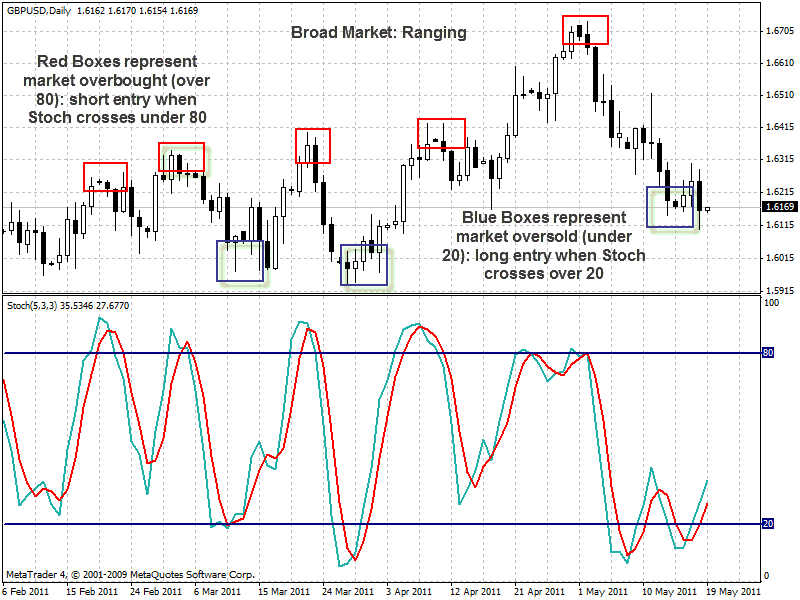
Between February to May 2011, the GBP/USD had been stuck in a 400 range between 1.6000 and 1.6400, and trading both sides of this range, taking buy trades in the oversold region and sell trades in the overbought region, would have resulted in a nice accumulation of pips. Notice that there was a breakout of the range towards the end of April when price headed up to test 1.6700.
In many markets such a breakout would put a lot of pressure on the preceding short signal that had entered in the overbought zone. However, in this case, the preceding short signal (the fourth red box on the chart) would have entered near the top of the range, at 1.6400, with the market soon after making a low of 1.6169 (250 pips below) before it rocketed back up and through the top of the range.
One could have won with this trade if the strategy had a profit target of 200-250 pips, or at the very least exited at a breakeven level prior to the market reversing and breaking through the range. It is with proper back-testing that one can determine the best take profit and breakeven levels for a given currency pair, just in case the market does break the range you are intending to exploit with the overbought/oversold method of Stochastics.
 Link másolása
 Megosztás a Facebookon
 Megosztás az X-en
 Megosztás e-mailben