Forex Trading Strategies: The 8-Hour Chart Strategy

Image Source: FreeImages
The forex market is open 24 hours a day, five days a week. It’s one of the reasons why many traders prefer this market to others. Since it never closes, you can always find an opportunity to trade.
Trading in the forex market also comes with a range of different time frames, which offer you plenty of opportunities to make profitable trades. In any type of trading, knowing your exit strategy is just as important as knowing your entry point.
While most traders focus on finding new entries, we believe that understanding exits is just as important for long-term success in any trading activity — whether it be forex, stocks or options.
That’s why today we will take a look at an excellent exit strategy for the forex markets that have proven to work exceptionally well over the past couple of years — the forex 8-hour chart strategy.
Table of Contents
What is the 8-hour chart strategy?
An 8-hour chart strategy is a trend trading strategy that works just like any other trend trading strategy. You have to have some kind of entry or exit strategy in mind. The 8-hour chart strategy is a trend trading strategy that uses the 8-hour chart to find the best possible opportunities for profits in the forex market.
Traders can use this strategy to make money in any type of trade using the same basic principles that they use when they are trading stocks, futures, commodities and other markets.
The 8-hour chart is a good way to find profitable opportunities in the forex market. Traders will often look for an entry point at a certain time frame and then wait until that time ticker line reaches an important number on their chart before deciding on whether or not they want to exit or enter the market. By timing out this process, traders will find more profitable trades than if they were trading all day long with no break-even range at all.
How does an 8-hour chart work?
This is a type of price action trading strategy. Price action trading is a form of technical analysis that studies the price of a security (in this case, the forex markets) without consideration of external factors. Price action traders rely solely on the pattern formed by a security’s price to forecast its future price movement.
The 8-hour chart strategy looks for trends in the forex markets and then uses the 8-hour chart to find areas where the trend has been broken, but the trend has not yet been fully retraced. In a trend, the 8-hour chart will show a series of higher highs and higher lows. When the trend is broken, the highs and lows will often be the same or very similar.
This is where the 8-hour chart strategy comes into play. When the highs and lows are the same, the trend has been broken. The trick is to buy as close to the break as possible to ensure a larger profit potential.
How to spot a good 8-hour chart opportunity?
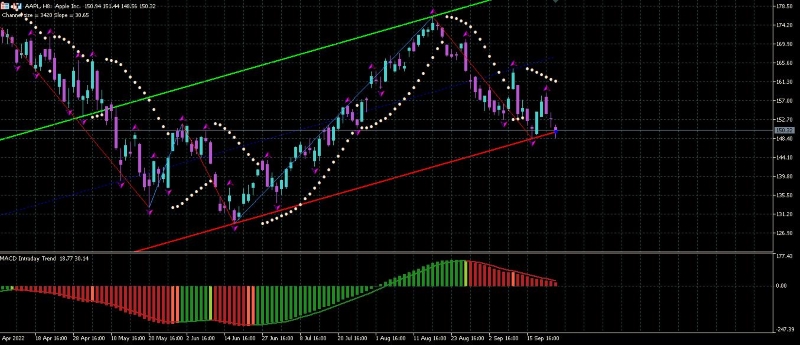
AAPL stock ticker 8-hour chart. Image source: MT5 trading platform
To identify a good 8-hour chart opportunity, you first need to identify a trend. In the forex markets, you can find a trend when the price action is moving in the same direction for at least one full cycle.
A full cycle is an entire process from the high to the low and back to the high again. We recommend using a daily price chart to identify a trend. Once you have identified a trend, it’s time to look for breakouts. Breakouts occur when security breaks out of a trend and creates a new trend. The 8-hour chart shows this type of breakout.
A breakout can be defined as a sign that the price is moving in the direction of the actual trend. If you look at an 8-hour chart, you can see that the higher highs are signalling that there is some type of breakout. The low below indicates that there is no breakout and it means that it’s time to sell off or buy back in.
You can also see that as the high falls lower, there will be more lows below until it reaches its lowest level. The lower lows are signalling a new level which means it’s time to move into another trade or buy back in on the same trade at this new level.
The 8-hour chart provides great insight into whether an investor wants to enter or exit any given trade or investment opportunity. Once you have identified a trend, you can easily spot when an opportunity will create a new trend and when an opportunity will create another trend.
This strategy is great for investors who want to take advantage of short-term opportunities but don’t want to commit their entire portfolio every month just because they wish to make some extra money on their investments each month and not for all time investing in stocks, bonds etc.
When the 8-hour chart shows higher highs and higher lows, the trend is intact. When the 8-hour chart shows the same highs and lows, the trend has been broken. This is where the 8-hour chart strategy comes into play. When the trend is broken, the 8-hour chart shows a series of higher highs and higher lows. This is your signal to buy.
8-Hour Chart Strategy: Entry Point
When the 8-hour chart shows a series of higher highs and higher lows, the trend has been broken. This is your signal to buy. The trick is to buy as close to the break as possible. Ideally, you want to enter the market at the exact moment when the trend is broken.
This will ensure that you catch the trend at its earliest stage. When trading with the 8-hour chart strategy, you should open a position as close to the break as possible and place a stop loss just below the trend break.
8-Hour Chart Strategy: Exit Point
When it comes to exit, you have two options. You can either close the trade after the trend retraces to the break, or you can hold the trade until the trend ends. Closing the trade after the trend retraces to the break is a safer exit strategy, but it also limits your profit potential.
Holding the trade until the trend ends will allow you to capture a larger profit, but it also comes with larger risk. When trading with the 8-hour chart strategy, you should exit the trade after the trend retraces to the break.
Conclusion
The 8-hour chart strategy is a trend trading strategy that uses the 8-hour chart to find high-probability trading opportunities. This strategy looks for trends in the forex markets and then uses the 8-hour chart to find areas where the trend has been broken, but the trend has not yet been fully retracted.
When trading with the 8-hour chart strategy, you should open a position as close to the break as possible and place a stop loss just below the trend break. You can either close the trade after the trend retraces to the break, or you can hold the trade until the trend ends.
 Copia link
 Condividi su Facebook
 Condividi su X
 Condividi via e-mail